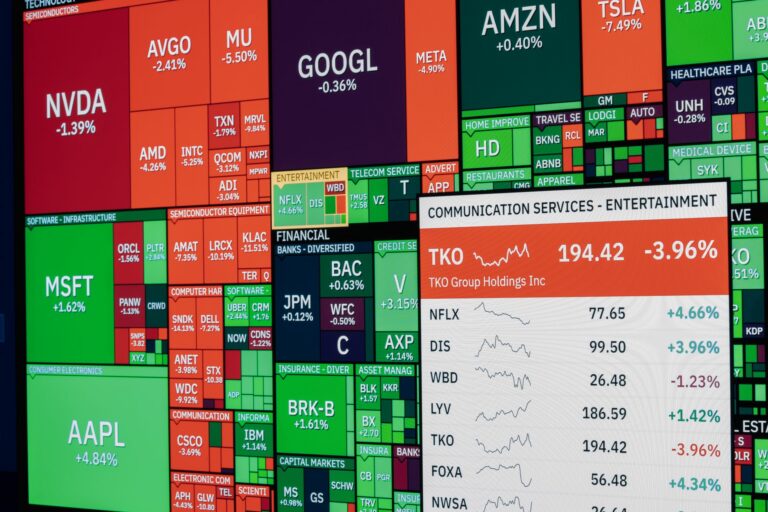
The Dow is trading near 52,900, up 1.1%, while the Nasdaq Composite is down 0.8% at 25,833. That split is the whole story. This Dow Jones analysis starts with a simple read: buyers are rewarding industrial exposure, but they haven’t confirmed a broad equity risk-on move yet.
I don’t like chasing index strength when the tape is split this cleanly. A strong Dow with a flat S&P 500 near 7,483 and a firmer VIX at 16.35 tells me capital is rotating, not flooding the market with confidence. That distinction matters because rotation trades can pay, but they punish late entries when traders mistake relative strength for full-market confirmation.
Dow Jones Analysis Today: Strength Near 52,900 in Context
Dow trades near 52,900 and leads major indexes with a 1.1% intraday gain
The Dow Jones Industrial Average is the clear leader on the board, trading around 52,900 with a 1.1% intraday gain. That is meaningful. The move shows buyers are willing to support value, industrial, and old-economy exposure while other parts of the equity market struggle for traction.
The problem is that index leadership is not the same as universal confirmation. The Dow can advance because a few heavyweight industrial, health care, financial, or consumer names attract flows, even while speculative appetite fades elsewhere. That is why I’m framing the advance through broader market analysis, not through the Dow chart alone.
Industrial leadership reflects relative strength, not automatic broad-market confirmation
Industrial leadership has a cleaner narrative right now than mega-cap growth. WTI crude is lower at $68.31, down 0.6%, which can help some margin-sensitive industrial stories. Recent OPEC+ output headlines, including reports that member countries agreed to increase production from August, add context to the softer crude tape and the industrial-margin discussion. Source: OPEC+ countries agree to increase oil production from August.
There is also stock-specific support inside the industrial complex. Caterpillar’s reported $100 million Texas workforce push for advanced manufacturing fits the broader theme of capital moving toward productive capacity, infrastructure, and manufacturing exposure. That doesn’t mean one company headline drives the Dow, but it helps explain why industrials can attract bids when tech is under pressure. Source: Caterpillar launches $100 million Texas workforce push.
Price action should be framed as rotation until other indexes confirm momentum
The Dow’s current strength deserves respect, but it still needs confirmation from the rest of the equity complex. A rotation bid can carry for several sessions, especially when institutions rebalance away from crowded growth trades. Still, a narrow move becomes fragile when hedging demand rises and speculative benchmarks fail to participate.
My opinion is straightforward: chasing a 1.1% Dow pop while Nasdaq is red and VIX is green is a low-quality entry unless intraday structure gives you a clean location. The better trade is usually waiting for a demand defense, a liquidity grab, or a controlled higher-low sequence instead of buying the first extended candle.
Is This Dow Rally a True Breakout or Rotation Trade?
S&P 500 is flat near 7,483, limiting the case for full-index risk-on strength
The S&P 500 is nearly unchanged around 7,483. That flat behavior weakens the argument that the entire equity market is breaking higher in sync. In a cleaner risk-on tape, I’d expect the S&P to expand with the Dow, breadth to improve, volatility to soften, and growth-heavy names to stop dragging.
That isn’t the current setup. The Dow has the bid. The S&P is sitting still. Nasdaq is lower. That combination often points to institutional repositioning rather than broad enthusiasm.
Stock market rotation favors industrials while mega-cap tech underperforms
Stock market rotation is the better framework here. Money appears to be moving toward Dow-linked sectors while pulling back from tech-heavy exposure. That can happen when investors want equity participation but don’t want the duration, valuation, or earnings sensitivity embedded in mega-cap growth.
For traders using SMC trading strategies, the practical point is location. Rotation can create clean continuation setups, but only when price respects structure. A leader that keeps printing higher lows while laggards bleed can still offer intraday opportunity. The key is to avoid treating the leader like the entire market has confirmed.
A clean bullish read requires broader participation beyond the Dow
A healthier bullish read would show the Dow holding above intraday demand while the S&P 500 turns from flat to constructive. Nasdaq does not need to lead immediately, but it should at least stop accelerating lower. Breadth also matters. A Dow bid led by a narrow pocket of names is less reliable than a bid supported by expanding participation across cyclicals, financials, transports, and selected consumer areas.
In my own index trading, the worst fills usually come from buying a strong Dow candle while Nasdaq is still leaking and volatility is firming. The chart can look powerful in isolation, but the tape underneath is already warning you to reduce size or wait for a better entry.
Why Does Nasdaq Divergence Matter for Risk Sentiment?
Nasdaq is down 0.8% at 25,833 while the Dow advances, creating a clear divergence
The Nasdaq Composite is trading at 25,833, down 0.8%, while the Dow is up 1.1% near 52,900. That is a clean Nasdaq divergence. It doesn’t automatically invalidate the Dow rally, but it changes the risk profile.
When the Dow leads and Nasdaq lags, the market is usually sending a message about preference. Investors may still want equities, but they are being more selective. That is very different from a session where all major indexes advance together with falling volatility and improving breadth.
Tech weakness warns against treating Dow strength as a universal equity breakout
Tech weakness matters because Nasdaq still carries a heavy influence over risk sentiment. Mega-cap technology, semiconductors, software, and high-beta growth names often set the tone for speculative appetite. When those areas fail to confirm, index traders should stay careful with breakout language.
Bitcoin at $61,718, down 1.5%, and Ethereum at $1,741, down 1.3%, add to the mixed read. Crypto weakness is not a direct signal for the Dow, but it does show that speculative risk is not being lifted across the board. Gold is up 0.5% at $4,146.90 as well, which leans defensive rather than euphoric. For cross-asset context, I’d keep an eye on gold liquidity behavior because precious metals often reveal stress before equity headlines catch up.
Risk sentiment remains mixed until Nasdaq stabilizes or breadth improves
Risk sentiment is mixed, and that word matters. The lower US 10-year yield at 4.461% helps equities by easing some rate pressure. But the US Dollar Index is firmer at 101.12, up 0.3%, while VIX is also higher. That blend does not describe a relaxed, all-clear equity environment.
A calmer read would require Nasdaq to stabilize, S&P breadth to improve, and volatility pressure to fade. Until then, Dow strength is tradeable, but I would not treat it as permission to buy every equity dip blindly.
How Do VIX, Yields, DXY, and Crude Shape the Read?
VIX is up 3.4% to 16.35, showing higher hedging demand during the Dow bid
VIX rising 3.4% to 16.35 while the Dow advances is one of the more important details on the screen. Equity strength with a higher volatility index means traders are still paying for protection. That can happen around event risk, index dispersion, or sector rotation, but it rarely screams clean risk-on.
A VIX level near 16.35 is not panic. It is contained. Still, the direction matters. When volatility rises into an equity bid, I want better confirmation before pressing longs. Price can keep grinding higher, but the margin for sloppy entries narrows.
The US 10Y yield is lower at 4.461%, easing some equity pressure, while DXY is firmer at 101.12
The US 10-year Treasury yield is lower at 4.461%, which removes some pressure from equities. Lower yields can support valuation multiples, help rate-sensitive sectors, and reduce the headwind for longer-duration assets. That should be supportive in theory.
The offset is the stronger dollar. DXY is up 0.3% at 101.12, with EUR/USD lower at 1.1412, GBP/USD softer at 1.3340, and USD/JPY higher at 162.40. A firmer dollar can tighten financial conditions at the margin and pressure multinational earnings translation. So the yield move helps, but the currency tape keeps the macro read from turning fully bullish.
WTI crude is down 0.6% to $68.31 after OPEC+ output headlines, supporting industrial-margin narratives
WTI crude trading at $68.31, down 0.6%, gives the Dow another supportive thread. Lower energy input costs can improve the narrative for manufacturers, transports, and some industrial operators. It also reduces inflation anxiety at the margin, which can help the equity bid.
That said, crude weakness can carry different meanings. A modest oil decline tied to supply headlines is one thing. A sharp drop driven by demand fears would be another. Right now, I would treat the $68.31 WTI print as a supportive input for Dow rotation, not as a standalone bullish signal for the entire market.
SMC Market Structure Levels to Monitor Intraday
Nearby intraday demand around the live Dow price matters most
For Smart Money Concepts traders, the live battleground is the demand created beneath the current Dow price near 52,900. I would map the last clean bullish impulse on the 5-minute and 15-minute charts, then watch whether price respects that area on a pullback. Static levels are less useful than the most recent zone where displacement actually originated.
The cleanest continuation pattern would show a controlled retracement, reduced selling pressure, and a recapture of minor intraday structure. That kind of response tells me buyers are defending the rotation bid rather than simply reacting to the opening move.
A liquidity sweep below the current zone could precede continuation if buyers reclaim structure
A stop-run below nearby intraday lows would not automatically damage the bullish case. In fact, many Dow continuation setups begin with a liquidity raid below short-term support, followed by strong absorption and a fast move back above the broken level. The reclaim is the key.
There is a big difference between a grab of resting sell-side liquidity and a real breakdown. A grab rejects quickly. A breakdown accepts lower prices, fails to recover structure, and turns prior demand into supply. That is why I care more about the reaction after the sweep than the sweep itself.
Failure to defend demand would weaken the isolated Dow leadership thesis
The bullish Dow thesis weakens when demand fails and price cannot recapture the lost zone. In that case, the index would no longer be showing strong leadership. It would be joining the broader mixed tape.
The practical read is simple: above defended demand, the Dow can keep leading. Below failed demand, the divergence risk grows. Traders who want more context can compare this setup with prior Dow rotation bid analysis and study whether current price is behaving like continuation or late-stage exhaustion.
Confirmation Checklist Before Chasing Dow Strength
S&P 500 breadth expansion instead of flat index behavior
The first confirmation signal is breadth. The S&P 500 sitting flat near 7,483 does not offer enough support for aggressive Dow chasing. I want to see more stocks participating, stronger sector alignment, and less dependence on a narrow group of Dow components.
- Better confirmation: S&P 500 turns positive with advancing sectors broadening.
- Weak confirmation: Dow remains green while S&P stalls and Nasdaq keeps fading.
- Best trade condition: Dow holds structure while lagging indexes stop deteriorating.
Nasdaq stabilization reduces the risk of bearish divergence
Nasdaq does not need to rip higher to help the Dow. Stabilization would be enough. A move from aggressive selling to sideways acceptance around the current 25,833 area would reduce divergence pressure and give the Dow bid more credibility.
Without that stabilization, traders need to respect the risk that Dow strength is a defensive rotation within equities. That can still be profitable, but it demands cleaner execution and tighter invalidation.
Higher lows, demand defense, and reduced volatility pressure
The last confirmation layer is structure. A Dow that continues printing higher lows near 52,900, defends fresh demand, and avoids heavy rejection has the right ingredients for continuation. Add softer VIX pressure and the setup improves.
My playbook here is patience over prediction. Let the Dow prove that buyers can defend the move after the first push, especially while Nasdaq divergence and higher VIX keep the broader tape mixed.
That is the difference between trading rotation and chasing headlines. I’m interested in the Dow while it holds structure, but I’m not ignoring the warning signs from Nasdaq, volatility, the dollar, and crypto. For more equity index setups as they develop, keep a watchlist tied to current market structure updates rather than reacting to one index in isolation.
FAQ
What is the main takeaway from this Dow Jones analysis?
The main takeaway is that Dow strength near 52,900 looks more like stock market rotation than a clean risk-on breakout. Industrials are leading, but Nasdaq weakness, flat S&P 500 action, and a higher VIX suggest traders should avoid chasing without broader confirmation.
Why is Nasdaq divergence important today?
Nasdaq divergence matters because the tech-heavy index is down 0.8% while the Dow is up 1.1%. That split means capital is rotating into industrials rather than lifting the entire market, so risk sentiment is not uniformly bullish across major equity benchmarks.
Does the lower 10-year yield support equities?
A lower US 10-year yield at 4.461% helps reduce some pressure on equities, especially rate-sensitive areas. However, the firmer DXY at 101.12 and higher VIX show conditions are not fully relaxed, so the yield move alone does not confirm broad risk-on momentum.
How should SMC traders view Dow market structure here?
SMC traders should watch whether the Dow defends nearby intraday demand around current price or first sweeps liquidity before attempting continuation. Holding structure supports the rotation bid, while a failed reclaim after a sweep would warn that buying pressure is weakening.
What would confirm a cleaner bullish Dow setup?
A cleaner bullish setup would require Dow leadership to stop being isolated. Traders should look for S&P 500 breadth improvement, Nasdaq stabilization, lower volatility pressure, and continued higher-low structure in the Dow before treating the move as a stronger breakout signal.
The forward read is clear: Dow bulls have control near 52,900 for now, but the next serious signal comes from whether Nasdaq stabilizes and the S&P broadens, or whether this rotation bid starts to lose structure. Which side of the split are you trusting?
Disclaimer: This article is for educational purposes only and is not financial advice. Trading involves risk, and you are responsible for your own decisions.