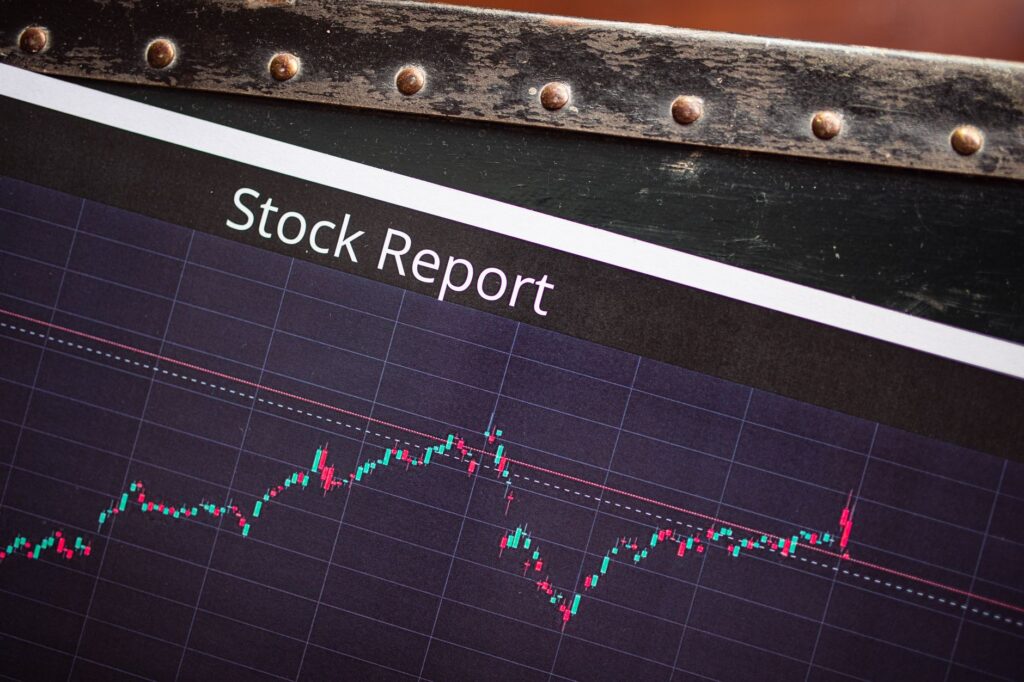
The Dow is the cleanest bid on the board right now, trading near 52,900 and up 1.1% intraday while the Nasdaq Composite sits near 25,833, down 0.8%. My dow jones analysis is simple: this tape is rewarding relative strength, not blind index buying. The S&P 500 is basically flat near 7,483, volatility is easing, and the jobs report has cooled some Fed pressure. That gives Dow bulls a valid setup, but only while price keeps accepting above the current 52,900 area.
I don’t view this as a market where traders should spray longs across everything. The rotation matters. Capital is moving toward Dow cyclicals and defensive industrial weight while high-beta technology, especially chips, takes the hit. That kind of tape can keep grinding higher, but it punishes late entries when traders chase highs without a pullback, a liquidity raid, or a clean structure confirmation.
Dow Jones Today: Defensive Rotation Leads The Tape
Dow Up 1.1% Intraday Near 52,900 As The Strongest Major Index Mover
The Dow Jones Industrial Average is trading near 52,900, up 1.1% intraday, making it the standout major US equity index in the current session. That matters because leadership is concentrated. When the Dow leads while the Nasdaq lags, the tape is usually telling us something specific about positioning, factor exposure, and risk appetite.
From a trader’s seat, I want to know whether the move is broad accumulation or a rotation bid. Right now, it looks more like rotation. The Dow is being treated as the cleaner long vehicle because the market is favoring mature cash-flow names, cyclicals, and lower-duration equity exposure over speculative growth. For readers tracking broader setups, I’d pair this with more market analysis because the index split is the trade, not background noise.
S&P 500 Flat Near 7,483 Shows Selective Strength, Not Broad Euphoria
The S&P 500 near 7,483 and flat on the session keeps the message honest. A flat S&P alongside a stronger Dow tells me the market is not in full risk-on mode. There is buying, but it’s selective. There is confidence, but not the kind of aggressive breadth that usually confirms a broad equity melt-up.
That distinction matters for execution. A flat S&P can support the Dow, but it also warns that index strength is being filtered through sector preference. Traders who treat the Dow’s 1.1% gain as proof that every equity dip should be bought are skipping the most important part of the read: buyers are choosing where to deploy capital.
Stock Market Rotation Favors Dow Cyclicals Over High-Beta Growth
The current stock market rotation favors Dow-linked cyclicals and steadier components over high-beta growth. That doesn’t mean tech is broken on a multi-month basis. It means the marginal buyer is acting differently right now. With volatility lower and yields still firm, the market is rewarding businesses that look less dependent on distant future earnings.
My opinion is blunt: rotation trades are better than headline trades. A jobs headline can spark the move, but relative strength tells you where institutions are actually placing money. The Dow is winning that contest for now, and as long as the spread holds, traders should respect it.
Why Is The Dow Outperforming Nasdaq Today?
Nasdaq Composite Down 0.8% Near 25,833 As Chips Slip
The Nasdaq Composite is trading near 25,833, down 0.8%, and semiconductor weakness is the obvious pressure point. A report from Global Banking & Finance Review also highlighted how chip softness and payroll data weighed on Wall Street, which matches the current index split: Dow bid, Nasdaq offered.
Nasdaq weakness matters because it changes the character of the equity session. A Dow rally with Nasdaq confirmation is a cleaner broad-market advance. A Dow rally while chips are being sold is a relative-strength trade with narrower participation. Both can make money. They require different risk management.
Semiconductor Weakness Signals Risk Reduction In High-Beta Tech
Semiconductors often sit near the front edge of growth appetite. When chips weaken while the Dow climbs, I read that as risk reduction in high-beta technology rather than a complete abandonment of equities. Managers may still want stock exposure, but they’re trimming areas that are more sensitive to earnings multiples, AI capex expectations, and rate pressure.
That creates a cleaner Dow setup because it removes some noise. Instead of asking whether “stocks” are bullish, I’d rather ask where capital is rotating. The answer today is clear enough: away from the Nasdaq’s more aggressive growth sleeve and toward parts of the market that can absorb firmer yields without immediately repricing lower.
Relative Strength Spread Makes The Dow-Nasdaq Divergence Cleaner
The spread between the Dow at 52,900, up 1.1%, and the Nasdaq at 25,833, down 0.8%, is wide enough to be useful. Small divergences can be random. This one has a theme. Dow strength plus Nasdaq weakness reflects a defensive rotation, not uniform bullish enthusiasm.
That gives traders a practical filter. Long ideas in the Dow deserve priority while the relative spread remains intact. Nasdaq-heavy longs need more proof because the weaker index is still absorbing supply. For me, the cleanest trades often come from respecting the strongest index and using the weakest index as a warning system.
Is The Jobs Report Reaction Bullish For Stocks?
Softer Labor Headlines Cool Fed Hike Fears
The jobs report stocks reaction is being interpreted through the Fed lens first. Softer labor headlines can cool hike fears, and that helps equities by reducing immediate policy pressure. The US Dollar Index is flat near 100.88, while gold is strong near $4,187, up 1.5%, which also fits a market digesting softer macro data. Kitco’s AM report noted gold nearing $4,200 as the dollar slipped after weak jobs data, a useful cross-asset clue for how traders are processing the report in the metals market.
The equity read is more nuanced. Softer jobs data can support stocks by lowering rate fear, but it can also raise growth concern if the data starts looking too weak. That’s why the Dow bid needs price acceptance, not just a macro headline.
Non-Tech Cyclicals Catch A Bid As Policy Pressure Eases
Non-tech cyclicals are catching a bid because lower perceived policy pressure makes it easier for investors to own areas tied to the real economy. Industrials, financials, healthcare, and consumer staples often become more attractive when traders want equity exposure without leaning heavily on expensive growth multiples.
The setup also explains why the Nasdaq is not participating. When the market believes rate pressure is easing but still worries about earnings quality in richly valued technology, the Dow can outperform without triggering a full risk-on chase. That is exactly the kind of session where stock pickers and index spread traders have an edge over passive buyers.
Jobs Report Stocks Reaction Still Needs Confirmation From Price Acceptance
The first reaction after labor data is often emotional. The second reaction matters more. I want to see whether the Dow can keep building value near or above 52,900 instead of tagging the high and fading back into the prior intraday range.
Price acceptance means buyers are willing to transact at higher levels, not just spike the market through a headline. A quick push above 52,900 followed by a failed high would weaken the bullish case. A controlled pullback into demand, followed by expansion back through the session range, would be much cleaner.
My read: the jobs report gave Dow bulls permission to press the rotation, but the chart still has to prove that buyers are defending higher prices.
Where Does SMC Market Structure Confirm The Bid?
Watch Dow Acceptance Above 52,900 For Bullish Continuation
For smc market structure, the current reference point is 52,900 because that is where the Dow is trading now. Bulls want acceptance above that area, meaning higher lows, constructive pullbacks, and buying that shows up after liquidity is taken rather than before it. The clean long is rarely the first candle into the high. It is usually the reaction after resting liquidity gets cleared.
In practical terms, I’m watching whether price can hold the upper portion of the current range. Sustained trade above 52,900 would keep bullish continuation alive. A move above the high that immediately rejects would warn that buyers paid too high and sellers used the breakout as liquidity.
Nearby Intraday Demand Sits Around The 52,500-52,900 Zone
Nearby intraday demand is best framed as a zone around 52,500 to 52,900, not a magic line. That zone matters because it captures the area where buyers have recently shown enough strength to push the Dow into leadership. In SMC terms, I’d look for mitigation, a protected low, and a fresh displacement leg out of that region before trusting a continuation entry.
For traders still sharpening that framework, I’d review SMC trading strategies and focus less on memorizing labels and more on reading intent. A demand zone only matters when price reacts from it with force. Weak bounces into immediate supply are usually traps.
Avoid Chasing Highs Without A Liquidity Sweep Or Pullback Confirmation
Chasing a Dow high near 52,900 after a 1.1% intraday move is where retail traders usually give back their edge. The better entry often comes after a stop-run below a minor low, a reclaim of the level, and a push that shows buyers are still in control. That sequence gives the trade structure. A market order at the top gives you hope.
I’ve seen this pattern across crypto, forex, and indices for years: the best-looking candle is often the worst entry when liquidity has already been harvested. The Dow can keep climbing, but I’d rather buy proof after a pullback than pay the high just because the headline feels bullish.
Volatility And Yields Keep The Setup Conditional
VIX Down 2.1% To 15.81 Helps Validate The Dow Bid
The VIX is down 2.1% to 15.81, which supports the Dow bid. Lower volatility means traders are paying less for protection, and that usually helps equity buyers hold risk. It also gives rotation trades more room to breathe because forced hedging pressure is not dominating the tape.
Still, VIX at 15.81 does not remove risk. It only says the market is calmer right now. Low volatility can persist during grind-up sessions, but it can also leave traders exposed when a headline changes the tone quickly.
US 10Y Yield Firm Near 4.485% Keeps Rate Risk Alive
The US 10-year yield is firm near 4.485%, up 0.2% on the snapshot, and that keeps rate risk alive. This is the part of the setup Dow bulls cannot ignore. A softer jobs reaction may cool Fed hike fears, but a firm 10-year yield still puts pressure on valuation-sensitive parts of the market.
The Dow can handle that backdrop better than the Nasdaq in the short run because it has less exposure to long-duration growth. That helps explain the current divergence. But yields near 4.485% mean the market has not fully shifted into an easy-money celebration. The rotation bid is valid, but it remains conditional.
Lower Volatility Does Not Remove Headline Or Macro Reversal Risk
Lower volatility and firmer yields create a mixed regime. The VIX says equity stress is contained. The bond market says rates are still a live variable. That combination supports tactical longs, not lazy conviction.
Gold strength near $4,187 and WTI crude near $68.78 add more context. Cross-asset markets are not screaming panic, but they are not uniformly relaxed either. Traders watching commodities can compare the Dow setup with recent gold reaction to the jobs miss and WTI crude liquidity near $68.68 to see how macro repricing is moving through different assets.
Trading Plan: Dow Strength Versus Nasdaq Weakness
Favor Dow Relative-Strength Longs Only While Price Accepts Above 52,900
The plan is to favor Dow relative-strength longs while price continues accepting around and above 52,900. I want the strongest index, the cleaner structure, and confirmation that buyers are defending higher prices. That doesn’t mean buying every green candle. It means waiting for a setup that gives a defined invalidation point.
A strong continuation would show a controlled pullback into the 52,500 to 52,900 demand zone, a hold above a protected low, and a fresh push back through intraday supply. That is the kind of sequence that keeps the long side attractive without forcing a trader to chase.
Keep Tech Heavy As A Filter For The Rotation Thesis
Tech should remain the filter. Nasdaq weakness near 25,833 is the reason Dow longs make sense as a relative trade, but it is also the warning. A deeper chip selloff could pressure the S&P 500 and eventually drag the Dow lower through index-level risk reduction.
On the other hand, a Nasdaq recovery with the Dow holding 52,900 would broaden the bullish case. That would shift the session from defensive rotation toward stronger market-wide participation. Until that happens, I prefer treating the Dow as the leader and Nasdaq as the risk gauge.
Invalidate The Long Bias On A Failed High And Bearish Structure Break
The long bias weakens if the Dow prints a failed high above the current area and then breaks below the intraday structure that created the advance. I’m looking for the sequence, not one candle. A rejection at the high, followed by lower highs and a decisive break back through demand, would tell me the bid has lost control.
Below the 52,500 to 52,900 demand zone, the market would need to rebuild before I’d trust fresh longs. That doesn’t automatically create a short setup, but it removes the reason to stay aggressively bullish. Good trading is often about knowing when the thesis is no longer paying you.
The forward-looking takeaway is straightforward: Dow strength near 52,900 is tradable while rotation holds, but the better entries should come from structure, not excitement. Are you treating this as a Dow-led rotation trade, or waiting for Nasdaq to confirm before trusting the broader market?
FAQ
What is the main Dow Jones analysis takeaway today?
The Dow is the strongest major index, trading near 52,900 and up 1.1% intraday. The move looks more like defensive stock market rotation than broad euphoria because the S&P 500 is flat near 7,483 while Nasdaq weakness persists around 25,833.
Why is Nasdaq weakness important for Dow traders?
Nasdaq is weaker because high-beta technology and semiconductor shares are being sold while capital rotates toward steadier Dow components. With the Nasdaq Composite down 0.8% near 25,833, the tape shows selective risk appetite rather than a uniform bullish breakout across equities.
How did the jobs report affect stocks today?
Soft jobs-report headlines appear to have cooled Fed hike fears, which helps non-tech cyclicals and lowers immediate policy pressure. Still, softer labor data can also signal growth risk, so traders should confirm acceptance, liquidity sweeps, or pullbacks before chasing Dow strength.
What SMC levels matter for the Dow?
For SMC market structure, the key area is whether price continues accepting above 52,900 or rotates back toward nearby intraday demand around 52,500-52,900. Bulls want higher lows, displacement, and clean mitigation; bears want a failed high followed by a structure break.
Do VIX and yields support buying the Dow today?
VIX falling 2.1% to 15.81 supports the Dow bid because volatility demand is easing. However, the 10-year yield near 4.485% remains firm, so rate pressure has not disappeared. That mix favors disciplined entries over emotional late longs at highs.
Disclaimer: This article is for educational market commentary only and is not financial advice or a recommendation to buy or sell any security, index product, or derivative.