WTI is trading at $95.66, up 1.6%, while the US 10-year yield sits at 5.325% and the dollar is firmer at 102.77. That combination is exactly why this WTI crude analysis matters: oil is pushing into nearby $96 buy-side liquidity while the broader tape looks tired, rate-sensitive, and quietly risk-off.
WTI Crude Snapshot: Clean Strength Into $96 Liquidity
WTI at $95.66, up 1.6% intraday
The cleanest move on my screen is WTI crude oil at $95.66. That 1.6% intraday gain matters because it is happening while equities are flat to weak, crypto is heavy, gold is lower, and Treasury yields are pressing higher. In other words, oil is not being dragged upward by a broad risk-on surge.
The immediate magnet is obvious: $96. That level is close enough to spot to matter, and round enough to attract stops, breakout orders, and late momentum buyers. Serious traders should treat it as a liquidity zone first, not a magic breakout line.
Why oil is the strongest allowed mover on the board
Across the live market snapshot, WTI is the standout. Gold is down 1.3% at $4,123.30. The S&P 500 is near 7,805 and essentially flat. Nasdaq is down 0.2%. Bitcoin is lower at $82,805. Ethereum is weaker at $2,480. That makes crude the asset showing the clearest upside impulse.
For broader context across markets, I’d compare this tape with other setups in more market analysis, because the strongest asset in a weak tape often tells you where positioning pressure is concentrated. Today, that pressure is in oil.
What a $96 buy-side liquidity sweep would signal
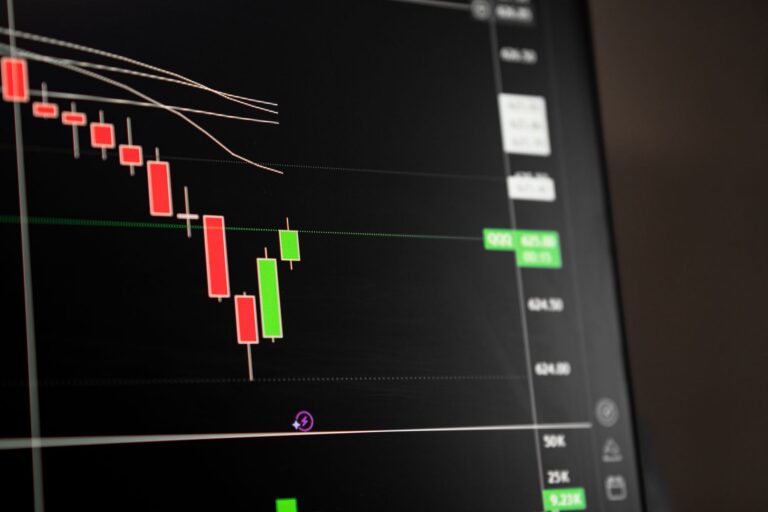
A push above $96 would likely raid short stops and trigger breakout participation. That is the easy part. The harder part is judging what happens after the stop-run.
A fast trade through $96 followed by failure back below the level would suggest liquidity was harvested rather than accepted. Acceptance above $96, especially with expanding volume and limited overlap on pullbacks, would carry a different message. That would point to buyers defending higher prices rather than simply chasing headlines.
My opinion: the first print through $96 is less important than the next 30 to 90 minutes of reaction. That is where the real information sits.
Why Is Oil Rallying While Broader Risk Assets Stall?
Middle East supply risk as the core rally driver
The main driver is middle east supply risk. When crude rallies while stocks, crypto, and gold fail to confirm, I don’t assume the market is celebrating growth. I assume traders are pricing a supply premium, inventory anxiety, or positioning stress specific to the energy complex.
Recent market coverage has also pointed to oil strength, dollar firmness, and gold weakness moving together, a mix that supports the view that crude is trading on its own supply-risk channel rather than a generic commodity bid. One snapshot from Mitrade’s market news coverage highlighted oil gains alongside a stronger US dollar and softer gold, which lines up with the cross-asset behavior on this board.
S&P 500 near 7,805 and Nasdaq down 0.2% show weak risk appetite
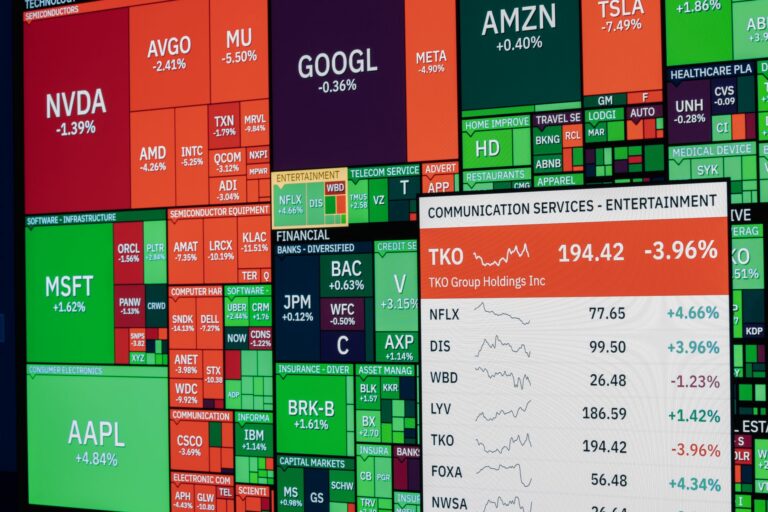
The equity tape is not giving oil much help. The S&P 500 sits near 7,805 and is basically unchanged, while the Nasdaq Composite is down 0.2% at 27,204. The Dow is also softer at 51,670, down 0.3%.
That matters because crude often gets cleaner continuation when cyclical assets are participating. Here, equity appetite is muted. Volatility is also up, with the VIX at 15.84, rising 3.7%. That does not scream panic, but it does tell me traders are paying more attention to downside protection.
Oil moving independently of equities confirms a commodity-specific impulse
When oil moves independently from equities, the read shifts. This is not a broad beta rally. It is a commodity-specific impulse, and that changes the execution standard.
In a pure risk-on environment, late longs can sometimes survive poor entries because liquidity keeps spreading across assets. In a risk-off or mixed tape, late longs near obvious liquidity tend to get punished faster. That is why I care so much about the $96 reaction rather than the headline print.
How Do 5.325% Treasury Yields Change the Oil Price Forecast?
Higher yields keep the rates inflation trade active
The US 10-year yield at 5.325% is a major input for any oil price forecast. Higher yields tighten financial conditions, pressure duration-sensitive assets, and keep the rates inflation trade alive. Oil strength feeds directly into that macro loop because energy prices sit inside inflation expectations, corporate margins, and consumer pressure.
This is why I also watch rate-heavy index structures, including setups discussed in Nasdaq analysis around 5.30% yields. Crude can be bullish on supply risk while the same move creates stress elsewhere. Markets do not have to agree across every asset class.
Strong oil can reinforce inflation pressure
Crude at $95.66 is already high enough to matter for inflation psychology. A sustained push above $96 would keep pressure on gasoline expectations, freight costs, and energy-sensitive sectors. Central banks may not react to one oil candle, but they do react when energy strength bleeds into broader inflation data.
That is the uncomfortable loop. Oil rallies because of supply risk. Higher oil supports inflation anxiety. Inflation anxiety supports yields. Higher yields increase macro pressure on risk assets. Then liquidity becomes more selective, which can make crude’s own breakouts more violent and less forgiving.
Chasing crude highs gets dangerous when yields are elevated
I’ve traded enough oil and FX over the last 12 years to respect one pattern: the best-looking crude breakout in a high-yield environment can still turn into a sharp bull trap when late buyers pile into a known stop area. The move can be real and still offer a bad entry.
That is the distinction traders often miss. Directional thesis and execution location are separate decisions. I can respect the bullish crude impulse and still refuse to buy directly into the $96 liquidity pocket without confirmation.
Dollar Strength Makes This Crude Oil Liquidity Move More Important
DXY up 0.6% at 102.77 creates a tougher backdrop for oil bulls
The US Dollar Index is up 0.6% at 102.77. That usually creates a tougher environment for dollar-priced commodities, including crude. A firmer dollar can reduce foreign purchasing power and dampen speculative appetite across commodities.
Yet WTI is still higher. That is exactly why the crude oil liquidity picture around $96 becomes more important. Oil is fighting a headwind and winning for now. The question is whether that strength represents real acceptance or a final push into resting liquidity.
WTI strength against a firmer dollar points to real demand or supply stress
When crude rises against a stronger dollar, I take the move more seriously. It suggests the bid is not simply a function of dollar weakness. Something else is pulling buyers in: physical market concern, geopolitical premium, inventory fear, or forced positioning.
That does not mean traders should blindly buy. It means the rally deserves respect. Dollar-adjusted strength is a confirmation filter, and right now that filter supports the idea that oil is trading on a genuine commodity catalyst.
FX-adjusted strength adds confirmation
EUR/USD is down 0.6% at 1.1126, GBP/USD is down 0.4% at 1.3200, and USD/JPY is higher at 158.83. The dollar bid is broad enough to matter. Crude strength under those FX conditions carries more weight than a rally during dollar weakness.
For traders who work across markets, this is also why the dollar should be part of every crude plan. Oil can ignore FX for a while, especially during supply shocks, but it rarely ignores FX forever. A sudden dollar extension can make marginal buyers disappear quickly.
Smart Money Concepts: What Matters At The $96 Sweep?
$96 is immediate buy-side liquidity, not automatic continuation
From a Smart Money Concepts lens, $96 is nearby buy-side liquidity. Stops above prior highs and round-number breakout orders create a target. Price does not need permission to trade there, and it does not need a deep pullback first.
For readers building a more structured model, I’d pair this setup with broader SMC trading strategies, especially liquidity mapping, displacement, and order-block validation. The crude chart is giving a clean case study because the level is close, visible, and emotionally charged.
Sweep-and-rejection setup versus acceptance above the high
The first path is a raid above $96 followed by rejection. That would tell me buy-side liquidity was taken and sellers used the breakout to distribute into late demand. A close back below the level, especially with a fast bearish expansion, would put the breakout in doubt.
The second path is acceptance. Price pushes through $96, holds above it, and treats the former liquidity area as support on a retest. That would be more constructive. I would still want to see the retest behave cleanly, with shallow pullbacks and buyers stepping in before the entire breakout leg is retraced.
Controlled pullbacks can reveal bullish order-block demand
The better long idea may come after the first excitement fades. A controlled pullback from the $96 region into a prior bullish displacement zone could expose demand. That is where bullish order blocks become useful, especially when the pullback is slow, overlapping, and unable to break structure aggressively.
There is a big difference between a healthy retracement and a failed reclaim. A healthy pullback respects the prior impulse and leaves buyers in control. A failed reclaim slices back through the breakout base and turns the $96 raid into a warning.
Execution Plan: Avoid Chasing, Wait For Cleaner Confirmation
Reaction after the sweep matters more than headline momentum
Headline momentum is loud. Execution should be quiet. I do not want to buy crude simply because it is up 1.6% and pressing a round number. I want to see whether the market can absorb supply after stops are triggered.
Investing.com has also covered how oil, rates, and risk assets are interacting, including pressure on crypto as yields and energy prices reprice risk appetite. That cross-market pressure, discussed in its analysis of oil, rates, and crypto risk, fits the current environment: strong crude does not automatically mean easy conditions for risk.
Potential long setup after displacement into demand
The cleaner long setup would be a push through liquidity, a confirmed acceptance phase, then a pullback into demand that holds above the prior breakout structure. I want to see bullish displacement first, then a retracement that looks corrective rather than panicked.
A trader could also watch for a lower-timeframe break of structure after the pullback, followed by a retest of the demand zone. That gives the trade a defined invalidation point. Without that structure, entries near $96 are mostly momentum bets.
- Constructive behavior: acceptance above $96, shallow pullbacks, and buyers defending retests.
- Neutral behavior: a sweep above $96 followed by sideways trade with no decisive rejection.
- Bearish behavior: fast loss of the breakout level, failed reclaim, and heavy selling back into the prior range.
Invalidation cues from failed reclaim or macro pressure
Invalidation does not need to be dramatic. A failed reclaim above $96, a sharp reversal candle, or a broad macro squeeze from yields and the dollar can be enough to stand aside. Crude can remain fundamentally supported while the short-term trade setup deteriorates.
That is why I prefer defined execution over narrative loyalty. Supply risk may keep a floor under oil, but traders still need to survive bad locations.
Commodity Cross-Check: Why Gold Weakness Matters
Gold down 1.3% at $4,123.30 confirms no broad hard-asset bid
Gold is down 1.3% at $4,123.30. That is important. A broad hard-asset inflation bid would usually show more support in gold, especially with geopolitical anxiety in the background. Instead, gold is slipping while crude rallies.
For a deeper look at gold’s own pressure points, compare this oil move with gold price analysis focused on yields and DXY. The divergence helps separate crude-specific supply risk from a general commodity inflation bid.
Oil-specific strength supports the Middle East supply-risk thesis
Oil’s strength looks more specific than systemic. That supports the middle east supply risk thesis and reinforces the idea that crude is trading on a targeted catalyst. Gold weakness does not invalidate the oil rally, but it does prevent me from treating the move as a blanket confirmation across inflation-sensitive assets.
Recent commodity coverage from Investing.com has also noted gold weakness as traders assess the Fed rate outlook and inflation data, which fits the pressure from higher yields. The point is simple: gold is not confirming a broad safe-haven rush here. Crude is doing its own work.
Gold divergence filters crude continuation risk
Divergence is a filter, not a signal by itself. Oil can keep rising while gold falls, especially when the crude catalyst is supply-related. Still, gold weakness tells me not to overstate the macro confirmation.
That keeps my oil price forecast constructive but conditional. I respect the strength above $95, I respect the $96 magnet, and I respect the supply-risk premium. I do not respect late, emotional entries into obvious liquidity without a plan.
FAQ
What is the main takeaway from this WTI crude analysis?
WTI is the cleanest mover today, trading near $95.66 and up 1.6% intraday. The move is supported by Middle East supply-risk premium, but the $96 area is immediate buy-side liquidity. That makes confirmation after a sweep more important than chasing the candle.
Why are higher Treasury yields important for oil traders?
US 10-year yields at 5.325% keep the rates inflation trade active. Strong oil can add inflation pressure, which may support higher yields and tighten financial conditions. That macro loop makes aggressive long entries near $96 more vulnerable to sudden rejection or risk-off flows.
Does dollar strength weaken the bullish oil price forecast?
A stronger dollar usually pressures commodities, but WTI is rising while DXY is up 0.6% at 102.77. That relative strength suggests the oil bid is not simply FX weakness. It points more toward real commodity demand, positioning pressure, or supply-risk stress.
What would Smart Money Concepts traders watch near $96?
SMC traders would treat $96 as nearby buy-side liquidity. A sweep above that level followed by rejection could mark a liquidity grab. Acceptance and continuation above it would be more constructive, while a controlled pullback could expose bullish order-block demand below the highs.
Why does gold falling matter for crude oil analysis?
Gold is down 1.3% at $4,123.30, so today’s commodity strength is not a broad hard-asset rally. That makes oil’s move more specific to crude supply risk and liquidity dynamics. It also warns traders not to assume all inflation-sensitive assets are confirming the rally.
Going forward, I’m watching whether WTI can hold acceptance above $96 or whether the market uses that level as a stop-run before rotating lower. Which reaction are you seeing on your crude chart?
Disclaimer: This article is for educational purposes only and is not financial advice, investment advice, or a recommendation to buy or sell any asset.