Gold is trading at $4,096.00, down 2.2%, and the tape is giving traders a clean lesson in macro pressure. This gold price analysis has to start with the two variables doing the damage: the US 10Y Treasury yield at 5.345% and the US Dollar Index at 102.43. When yields rise and the dollar firms at the same time, XAU/USD usually loses breathing room fast. That doesn’t automatically make the larger trend bearish, but it does mean weak longs are being forced to answer uncomfortable questions.
The move is sharp enough to matter, but I’m not treating it as emotional capitulation. The VIX is only at 15.77, even with a 5.1% rise, while the S&P 500 is still up 0.6% and the Nasdaq is up 0.4%. That mix tells me the market is repricing gold specifically through rates and dollar strength, rather than dumping risk across the board.
What Is Driving Today’s Gold Selloff?
XAU/USD trades at $4,096.00, down 2.2% on the session
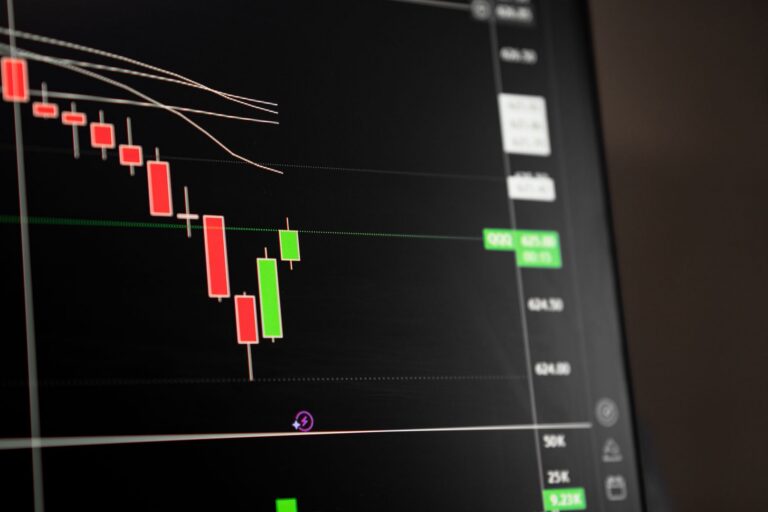
XAU/USD is sitting near $4,096.00 after a 2.2% session decline. That is a meaningful hit from a short-term positioning perspective because gold had been trading with a strong bullish premium, and crowded bullish structures are vulnerable when the macro backdrop shifts suddenly.
I watch gold differently from equities or crypto because the metal can look technically strong right until rates start pushing against it. A bullish chart with stretched positioning can unwind quickly when the yield curve reasserts itself. That is what this tape looks like so far.
For broader cross-asset context, traders can follow more market analysis, but the core issue for gold right now is simple: higher real return alternatives and a stronger dollar are reducing the immediate appeal of holding bullion.
The decline is the strongest allowed mover today, making gold the session’s standout flush
Within this gold-focused setup, the 2.2% decline is the session’s standout flush because it directly challenges prior bullish positioning in XAU/USD. Crypto is weaker on the broader snapshot, with Bitcoin down 3.2% and Ethereum down 5.4%, but that is a separate risk pocket. Gold’s move is cleaner from a macro read because it lines up almost perfectly with Treasury yields and DXY strength.
Generic market-mover feeds are busy with everything from stock rating changes to individual equity rebounds. For example, moomoo’s pre-market mover roundup tracks equity-driven headlines, while TradingKey’s ETH update focuses on crypto volatility. Those are useful side notes, but they do not explain why gold is being sold at $4,096. The better explanation is rate-and-dollar repricing.
The move is led by yield-and-dollar repricing, not broad panic liquidation
A panic liquidation usually comes with uglier index breadth, a more aggressive VIX spike, and a stronger bid into defensive cash. That is not the full picture here. The S&P 500, Nasdaq Composite, and Dow Jones Industrial Average are all positive on the session, while WTI crude is also higher at $89.94.
That makes the gold selloff more specific. The market is not saying “sell everything.” It is saying gold is vulnerable when yields rise and the dollar catches a bid. That distinction matters because panic setups and repricing setups demand different trade plans.
My read: this is a forced positioning adjustment in XAU/USD, not proof that every higher-timeframe buyer has disappeared.
How Do Treasury Yields Pressure Non-Yielding Gold?
US 10Y Treasury yield rises to 5.345%, lifting the opportunity cost of holding bullion
Gold does not pay interest. Treasuries do. When the US 10Y yield pushes up to 5.345%, the opportunity cost of holding non-yielding bullion rises. That does not mean gold must fall tick for tick with yields, but it does create a headwind that traders cannot ignore.
This is the part many retail traders underestimate. They stare at a support line and forget that large capital allocators compare gold against other stores of value and income-producing instruments. A higher Treasury yield makes that comparison less favorable for gold, especially when speculative longs are already extended.
I’ve seen this pattern for years across gold and major FX pairs. When rates reprice quickly, technical support often gets tested before the broader trend has time to fully respond. The candle looks violent because liquidity is thin under crowded positioning, not necessarily because the long-term thesis has changed in one session.
Higher yield expectations can force prior bullish liquidity to unwind
Smart money concepts traders should view the current drop through liquidity, not emotion. Gold’s fall toward $4,096 has likely forced late buyers to reduce exposure, especially anyone who chased strength without a defined invalidation level. Stops under short-term swing lows become fuel.
That fuel is what creates the sharp red candle. Price runs into sell-side liquidity, triggers stops, fills resting orders, and only then gives us useful information. The real question is what happens after the raid. Does price accept lower, or does it snap back and show bullish displacement from a discounted area?
For traders refining that process, the SMC trading strategies section is the better place to go deeper. The key idea here is that a stop-run by itself is not a short signal. It is a liquidity event that needs confirmation.
Why Does DXY Strength Matter For XAU/USD?
DXY gains 0.6% to 102.43, creating direct dollar pressure on gold
DXY is up 0.6% to 102.43, and that matters because gold is priced in dollars. A stronger dollar makes XAU/USD more expensive for non-dollar buyers and often weighs on speculative demand. The effect is especially sharp when yields are rising at the same time.
Gold can rally with a firm dollar under certain conditions, usually when fear demand is strong enough to overpower currency pressure. That is not the present tape. With VIX at 15.77, risk is firmer but not disorderly. The dollar bid is acting like a direct weight on XAU/USD rather than being offset by panic buying.
There is also a positioning angle. Dollar strength often forces leveraged gold longs to reassess because their thesis depends on more than chart structure. When the dollar rises, the margin for error gets smaller.
EUR/USD falls 0.7% to 1.1175, confirming broader dollar demand
EUR/USD is down 0.7% at 1.1175, which confirms the dollar move is broad rather than isolated. GBP/USD is also lower at 1.3202, down 0.5%, while USD/JPY is slightly higher at 158.20. That basket tells the same story: dollar demand is active.
For gold traders, confirmation across FX matters. A rising DXY supported by euro weakness is more credible than a narrow dollar pop against one currency. It tells me XAU/USD is not fighting a single headline. It is fighting a full dollar impulse.
The same yield pressure is showing up in equity index narratives as well. I covered that relationship recently in Nasdaq analysis around elevated yields, and the logic transfers cleanly to gold: when rates become the dominant variable, technical setups need tighter confirmation.
Is This Gold Selloff A Trend Reversal Or Liquidity Run?
SMC read: sell-side liquidity has been raided below prior bullish positioning
From a smart money concepts lens, the first read is a sell-side liquidity raid. Price has pressed lower into areas where prior longs likely had stops, and the speed of the move suggests forced liquidation more than orderly distribution.
That does not make the drop harmless. Liquidity runs can become reversals when price fails to recover and accepts below the swept area. But the sequence matters. A raid followed by immediate recovery is very different from a raid followed by bearish continuation and weak rebounds.
My opinion is blunt: buying gold just because the candle is red is lazy trading. A discount is only useful when the market proves demand is willing to defend it.
Reversal confirmation requires acceptance below the $4,050 to $4,000 zone
The $4,050 to $4,000 area is the zone I care about next. With gold currently near $4,096, that band is close enough to matter without being a distant hypothetical. Acceptance below it would change the tone because it would show sellers holding control under a major psychological and structural area.
Acceptance means more than a wick. I want to see bodies closing below the zone, weak recoveries into supply, and continued downside expansion. A fast flush through $4,050 that immediately reclaims the level would look more like a trap than confirmation.
That is why I’m not calling this a confirmed reversal yet. The selloff has damaged short-term structure, but the market has not proven that sellers can build value below $4,000.
Until then, treat the flush as repricing inside the current volatility structure
The cleaner stance is to treat this as repricing inside an elevated volatility structure. Gold has enough range to move toward $4,000 without automatically breaking the broader regime. That can frustrate traders who want a simple bullish or bearish label, but markets rarely owe us clean labels.
Compare today’s gold move with the previous bullish context covered in XAU/USD strength above $4,240. A market can rally aggressively, trap late longs, sweep liquidity, and still remain structurally unresolved until the next acceptance test.
Gold Price Analysis: Which XAU/USD Levels Matter Next?
Near-term resistance sits around the $4,150 to $4,200 imbalance area
The first upside area I’m watching is $4,150 to $4,200. That zone likely contains imbalance from the current drop, meaning price moved through it quickly without much two-way trade. When markets rebound into those pockets, supply often shows up.
A move back into $4,150 to $4,200 would not automatically make gold bullish again. It would test whether sellers defend the breakdown area and whether trapped longs use the bounce to exit. That reaction will tell us more than the first red candle did.
Trapped longs may reduce exposure into that imbalance if price rebounds
Trapped longs create overhead pressure. Traders who bought late during the prior advance may not want to hold through another push lower, so a rebound can become their exit window. That selling can cap price before a full recovery develops.
SMC traders should watch the quality of any rally. Slow, overlapping price action into $4,150 to $4,200 favors a bearish reaction. Strong displacement through that zone, followed by support holding on a retest, would weaken the bear case.
A deeper move toward $4,000 could still fit current volatility without proving breakdown
A push toward $4,000 would feel dramatic because round numbers attract attention, but it would still fit the current volatility profile. Gold is already down 2.2%, and the distance from $4,096 to $4,000 is manageable in this environment.
The important distinction is acceptance. Price tagging $4,000 and reclaiming quickly is one story. Price building value below $4,000 with sellers defending every bounce is another. I care less about the level being touched and more about how the market behaves after touching it.
How Should Smart Money Concepts Traders Respond?
Do not buy gold simply because the candle is red
A red candle near a round number is not a strategy. It is a temptation. The market punishes traders who confuse “down a lot” with “cheap.”
For me, the better approach is patience. Let gold show whether sell-side liquidity has been fully taken or whether the market still needs to drive lower. A cleaner long setup would require evidence that sellers are losing control, not just a feeling that price has fallen enough.
- Avoid blind dip buying while yields and DXY remain firm.
- Track reaction around $4,050 to $4,000 for acceptance or rejection.
- Respect $4,150 to $4,200 as potential rebound resistance.
- Size risk around invalidation, not around hope.
Wait for a liquidity sweep, bullish displacement, and a valid order block
The long setup I would respect starts with a clear sweep into sell-side liquidity, followed by a strong bullish expansion away from the lows. After that, I want a valid order block or demand area that holds on retest. Without that sequence, the trade is incomplete.
The short side has its own requirements. Sellers need to defend premium areas, especially $4,150 to $4,200, and produce fresh downside continuation. A weak bounce into that zone followed by rejection would be more attractive than chasing price lower at $4,096.
Oil traders are dealing with their own volatility around $89.94, and I covered related commodity pressure in WTI crude oil analysis near $89. Gold is different, but the discipline is the same: location first, confirmation second, execution last.
Use VIX at 15.77, up 5.1%, as context: risk is firmer but not panic
VIX at 15.77 tells me risk is firmer, not panicked. That matters because panic conditions can create gold demand even when the dollar is strong. Right now, the market is not sending that message.
The better read is mixed regime. Equities are green, the dollar is stronger, yields are higher, crypto is under pressure, and gold is being repriced lower. That combination favors tactical trading over big declarations.
For the next session, I’m watching whether XAU/USD can stabilize above $4,050 or whether sellers force acceptance into $4,000. The answer will decide whether today’s flush becomes a tradable recovery setup or the first leg of a deeper reset.
FAQ
Why is gold falling today?
Gold is falling because the US 10Y Treasury yield has jumped to 5.345%, raising the opportunity cost of holding non-yielding bullion. At the same time, DXY is up 0.6% to 102.43, adding direct pressure to XAU/USD and accelerating the intraday gold selloff.
Is this XAU/USD move a confirmed trend reversal?
Not yet. From a smart money concepts perspective, the drop looks more like a sell-side liquidity run than a confirmed bearish reversal. Confirmation would require acceptance below the $4,050 to $4,000 zone, followed by weak reactions and continued downside displacement rather than an immediate reclaim.
What levels matter most for gold price analysis now?
With gold trading near $4,096, the $4,050 to $4,000 area is the key downside acceptance zone, not proven support. On rebounds, the $4,150 to $4,200 imbalance is important resistance because trapped longs may use that area to reduce exposure after the flush if price revisits it intraday.
How does DXY strength affect gold?
Gold is quoted in dollars, so a stronger DXY makes XAU/USD more expensive for non-dollar buyers and can pressure speculative demand. Today’s 0.6% DXY rise to 102.43, combined with EUR/USD falling 0.7% to 1.1175, reinforces the dollar-pressure narrative for gold.
Should traders buy gold after a 2.2% drop?
Not automatically. A red candle is not a buy signal. The cleaner SMC approach is to wait for a liquidity sweep, clear bullish displacement, and a valid order block. Without those conditions, buying into yield-and-dollar repricing can mean catching continuation risk.
Gold’s next message should come from the $4,050 to $4,000 zone and the $4,150 to $4,200 rebound area. Which side proves acceptance first?
Disclaimer: This article is for educational market commentary only and is not financial advice or a recommendation to buy or sell any instrument.