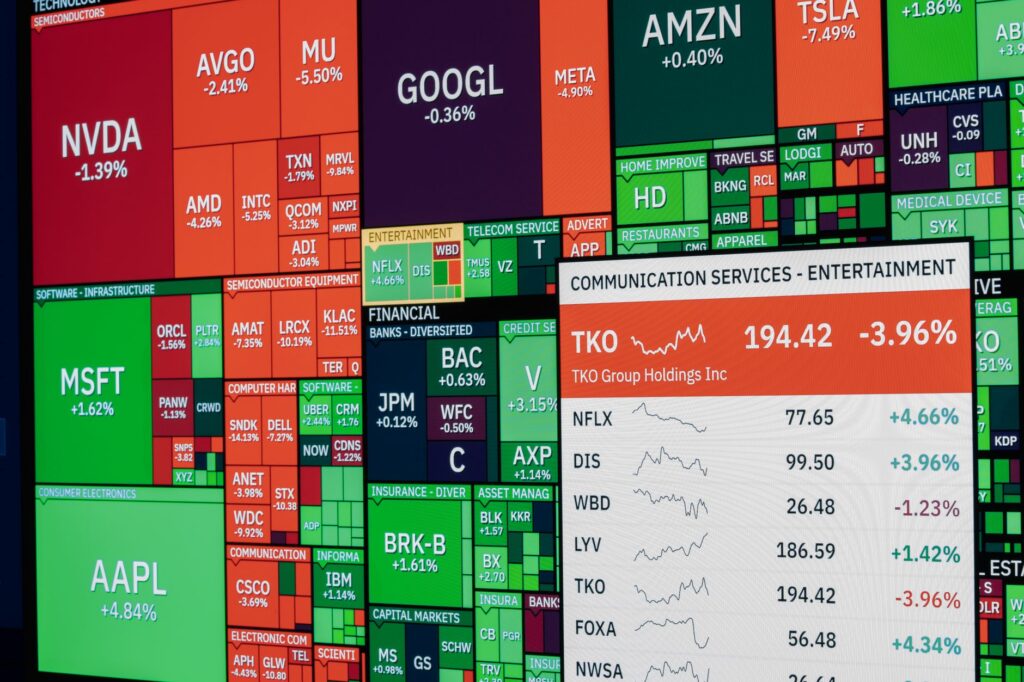
The Nasdaq Composite is trading at 27,191, up 1.2% intraday, while the US 10 year Treasury yield sits at 5.303%. That combination is the whole story. My Nasdaq analysis here is simple: tech is leading, buyers are still willing to pay for growth, but the tape is doing it against rates, dollar strength, and a rising VIX. That is tradable. It is also a poor place to get emotional.
The immediate battleground is tight. Price is sitting right inside the 27,190 to 27,250 decision area, where a clean acceptance can extend the rally and a rejection can expose late buyers. I’m treating this as a premium-zone test, not a blind breakout.
Nasdaq Analysis Market Snapshot: Nasdaq Composite Leads The Stock Market Rally
Nasdaq Composite trades at 27,191, up 1.2% intraday, making tech the clear leadership group.
The Nasdaq Composite is outperforming the major US indices at 27,191, up 1.2% on the session. That matters because leadership tells you where institutions are willing to take the most valuation risk. When tech leads during a mixed macro regime, the market is usually saying one of two things: growth expectations are improving, or positioning was too defensive and buyers are being forced back in.
I lean toward a blend of both. The move is strong enough to respect, but the surrounding conditions are not clean enough to chase. For broader context across active markets, I’d keep an eye on more market analysis rather than reading the Nasdaq in isolation.
S&P 500 confirmation at 7,723, up 0.7%, supports broad risk appetite but shows Nasdaq outperformance.
The S&P 500 is also higher at 7,723, up 0.7%, so this is not just a single-index squeeze. The Dow Jones Industrial Average is firmer at 51,177, up 0.5%. That gives the stock market rally some confirmation, although the Nasdaq Composite is clearly the stronger expression of risk appetite.
Equity breadth still deserves monitoring. Live market mover screens, including S&P 500 top gainers data, can help show whether upside is spreading beyond a narrow group of mega-cap technology names.
Leadership takeaway: buyers are paying a premium for growth despite macro friction.
That is the key read. Buyers are not hiding in defensives. They are paying up for technology even while yields and the dollar push against the trade. My opinion is direct: this is bullish leadership, but it is not the kind of tape where I want to buy extended candles without a retest, a displacement, or a liquidity event that gives structure.
Trading read: Nasdaq strength deserves respect above 27,000, but the best trades are likely to come from confirmation around 27,190 to 27,250 or a stop-run beneath 27,100 that quickly recaptures the level.
Why Is The Nasdaq Rally Fighting A Hostile Rates Backdrop?
US 10 year Treasury yield sits at 5.303%, up 0.5% on the day, raising the hurdle for growth-stock valuations.
The 10 year Treasury yield at 5.303% is not a small detail. Higher yields raise the discount rate applied to future earnings, and that usually puts more pressure on long-duration growth stocks. Technology can still rally in that environment, but the bar is higher. Buyers need stronger conviction because valuation math is less forgiving.
After years of watching index rallies around rate shocks, I’ve learned to separate price strength from clean liquidity. Strong price action can overpower macro pressure for a while. It still needs acceptance, volume, and market structure to prove the move is more than a squeeze.
DXY strength at 102.22, up 0.3%, adds pressure to foreign revenue-heavy technology names.
The US Dollar Index is also firm at 102.22, up 0.3%. A stronger dollar can pressure multinational technology companies because foreign revenue translates less favorably back into dollars. That does not automatically kill the Nasdaq rally, but it adds another headwind.
Currency markets are confirming dollar demand as EUR/USD trades at 1.1210, down 0.4%, GBP/USD trades at 1.3218, down 0.2%, and USD/JPY trades at 158.24, up 0.3%. The dollar bid is real enough to matter.
Macro read: this is a risk-on move, but not an easy-liquidity environment.
Risk assets are mostly higher. Bitcoin trades at $85,875, up 0.9%, and Ethereum trades at $2,711, up 0.6%. That supports the idea that traders are leaning risk-on across asset classes. For crypto-specific risk appetite, I’d track more crypto analysis alongside index behavior.
Still, rates and the dollar are not giving the Nasdaq an open runway. WTI crude is lower at $90.27, down 0.9%, while gold is firm at $4,183.60, up 0.5%. That mix fits a market where traders are taking risk, but also paying for protection and watching inflation-sensitive inputs. For a parallel read on commodity pressure, see this WTI crude oil analysis.
Is The VIX Warning Against A Clean Risk-On Read?
VIX rises 5.7% to 16.18 while equities climb, creating a mixed-risk tape.
The CBOE Volatility Index is up 5.7% to 16.18 while stocks rally. That is the detail that stops me from calling this a clean risk-on session. Equity strength with a rising VIX often means traders are buying upside but also paying for hedges. It can also mean options dealers are dealing with unstable flows under the surface.
At 16.18, the VIX is not screaming panic. It is elevated enough to say traders are not fully relaxed. That matters near premium levels because late longs can get shaken out quickly when volatility expands.
A rising VIX during an equity rally can signal hedging demand, short covering, or unstable upside participation.
There are several ways to read the same condition. Portfolio managers may be adding exposure while buying downside protection. Short sellers may be covering into strength. Options flows may be pulling price higher while underlying participation remains uneven. None of those explanations require a bearish call, but all of them argue for discipline.
Single-stock watchlists can also influence intraday Nasdaq tone, especially when large technology names dominate flows. Market calendars and watchlists such as stocks to watch for October 5, 2026 are useful only when paired with index structure. A headline stock can lift sentiment. The index still has to hold its levels.
Conclusion: Nasdaq strength is tradable, but not a free long without confirmation.
I like the leadership. I dislike the location for fresh, impulsive entries. That is the tension. The Nasdaq Composite is strong at 27,191, but it is pressing into the same 27,190 to 27,250 band that should separate acceptance from rejection.
A trader does not need to predict the next 300 points. The job is to identify where trapped buyers, resting buy stops, and liquidity pockets are likely sitting. That is where SMC trading strategies become practical rather than decorative.
Smart Money Concepts Map: Premium, Liquidity, And Market Structure
The 27,190 to 27,250 area is the immediate premium-zone decision area for Nasdaq buyers.
From a smart money concepts lens, the Nasdaq is trading in a premium decision area right now. The 27,190 to 27,250 zone is close enough to current price that it should be treated as active, not theoretical. Buyers above this band need follow-through. Sellers need a rejection strong enough to pull price back beneath the nearby structure.
Premium does not mean price must fall. It means the burden of proof shifts. Buying premium requires acceptance. Selling premium requires evidence that buyers are failing.
Acceptance above 27,250 keeps buy-side liquidity in play and supports bullish continuation logic.
A sustained hold above 27,250 would keep buy-side liquidity in focus. That would suggest buyers are not only reacting to a liquidity grab, but actually accepting higher prices. In that case, the Nasdaq could continue grinding higher as shorts cover and underexposed buyers chase confirmation.
I would still avoid assuming a straight-line advance. A cleaner bullish pattern would be a push above 27,250, a controlled pullback into the zone, and then a firm defense. That sequence gives more information than one green candle.
A sweep below 27,100 followed by a reclaim would create a cleaner smart money concepts long setup than chasing the current green candle.
The cleaner long, in my view, comes from a raid below 27,100 that quickly reclaims the level. That would flush early longs, collect sell-side liquidity, and give buyers a better location. It would also help identify whether institutions are absorbing supply or simply marking price higher into poor participation.
This is where patience pays. Chasing at 27,191 while VIX is rising and yields are above 5.30% leaves little room for error. Waiting for a liquidity event can mean missing part of the move, but it often improves decision quality.
What Would Confirm Durable Buyer Control?
Sustained acceptance above 27,190 to 27,250 would show buyers are defending premium rather than only reacting to liquidity.
Durable buyer control starts with acceptance. The Nasdaq Composite needs to hold the 27,190 to 27,250 area long enough to show that sellers are not overwhelming the tape at premium prices. A brief wick above the zone is not enough. A close, consolidation, or repeated defense above that area carries more weight.
The character of pullbacks also matters. Shallow pullbacks with quick recaptures show demand. Heavy retracements through prior impulse legs show that the move may be more fragile than the headline gain suggests.
Broad participation from the S&P 500 should continue to confirm the stock market rally.
The S&P 500 at 7,723, up 0.7%, is already helping confirm risk appetite. Bulls want that confirmation to continue. A Nasdaq-only rally can work, especially when mega-cap technology is in control, but broad participation reduces the chance that the move is just a narrow positioning squeeze.
Strength across indices also helps absorb macro friction. When the Nasdaq, S&P 500, and Dow are all green, buyers have more evidence that the rally is broader than one theme. That does not remove risk. It improves the quality of the read.
Market structure should hold above 27,000 to keep the bullish intraday thesis intact.
The 27,000 level is the line I care about for the broader intraday structure. Holding above it keeps the bullish thesis intact. Losing it would tell me the premium test failed and that sellers have forced price back into a lower value area.
Above 27,000, pullbacks can still be constructive. Below it, the Nasdaq starts to look less like controlled accumulation and more like a liquidity-driven move that ran out of sponsorship.
What Would Warn That Nasdaq Strength Is Liquidity-Driven?
Failure to hold above 27,000 would weaken the institutional accumulation argument.
A decisive move beneath 27,000 would damage the bullish intraday structure. It would show that buyers could not defend the base beneath the premium decision area. That would not automatically create a swing short, but it would force me to stop treating the rally as strong institutional control.
The way price loses 27,000 matters. A slow drift can be repaired. A sharp displacement lower after a failed push above 27,250 is more serious because it traps buyers who entered late.
A fast rejection from 27,190 to 27,250 would imply buyers are not accepting premium prices.
The current zone is the test. A fast rejection from 27,190 to 27,250 would suggest that the market used the rally to access liquidity rather than to build higher value. Watch the speed of rejection, not just the level. Fast downside after a premium tag often tells you aggressive sellers found enough demand to fill into.
That is why I do not treat every breakout as confirmation. In smart money concepts, location and reaction matter more than the candle color.
A sweep below 27,100 without reclaim would shift focus from continuation to downside liquidity risk.
A move below 27,100 can be bullish when it raids liquidity and recaptures quickly. The same move becomes bearish when price stays offered beneath the level. No reclaim means trapped longs remain trapped, and sellers can press toward deeper liquidity.
My working stance is balanced: bullish while structure holds, selective while price sits in premium, cautious beneath 27,000. That is enough. Traders get into trouble when they need the market to be cleaner than it actually is.
FAQ
What is the main takeaway from this Nasdaq analysis?
The Nasdaq Composite is leading the stock market rally at 27,191, up 1.2% intraday, while the S&P 500 confirms broader risk appetite at 7,723, up 0.7%. The issue is the backdrop. The 10 year Treasury yield is at 5.303%, DXY is firmer at 102.22, and VIX is up 5.7% to 16.18. That makes this a selective risk-on move, not a risk-free breakout.
Why do rising 10 year Treasury yields matter for the Nasdaq Composite?
Rising 10 year Treasury yields raise the discount rate applied to future earnings, which pressures growth and technology valuations. With the yield at 5.303% and higher on the day, Nasdaq buyers are absorbing a meaningful macro headwind rather than rallying in an easy-liquidity environment.
What levels matter most for smart money concepts today?
The immediate smart money concepts decision zone is 27,190 to 27,250, where acceptance would keep buy-side liquidity in play. A sweep below 27,100 followed by a reclaim is cleaner for longs than chasing. Failure above 27,000 warns that strength may be liquidity-driven rather than durable institutional accumulation.
Is the VIX confirming the stock market rally?
Not cleanly. The VIX is up 5.7% to 16.18 while equities climb, which means volatility is not confirming full complacency. That combination can appear during hedged buying, short covering, or unstable upside participation, so the rally deserves confirmation through market structure and acceptance signals.
What would invalidate the bullish Nasdaq view intraday?
A failure to hold above 27,000 would weaken the bullish intraday read because it would show buyers could not defend the broader structure beneath the premium decision area. In that case, the strength would look more like a liquidity event than durable institutional accumulation.
The next useful signal is simple: does the Nasdaq accept above 27,250, or does it raid 27,100 and fail to reclaim? That answer should guide the next trade better than any headline.
Disclaimer: This analysis is for educational purposes only and is not financial advice. Trading indices, forex, commodities, and crypto involves risk, and you are responsible for your own decisions.