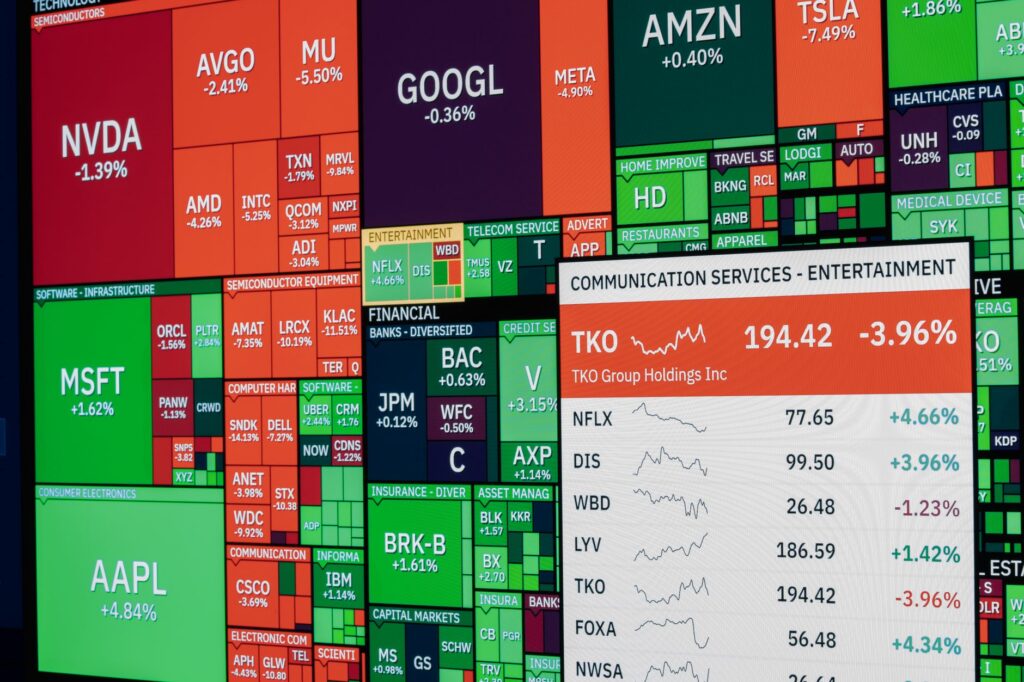
The Dow is doing the heavy lifting while the rest of the US index board looks selective. At 52,178, the Dow Jones Industrial Average is up 1.1% intraday, outpacing the S&P 500 at 7,744 and the Nasdaq Composite at 26,713. That makes this dow jones analysis less about a blanket equity melt-up and more about rotation, liquidity, and whether institutions are paying up for industrial and value-linked exposure ahead of CPI retail sales data.
I like Dow leadership when volatility is falling, but I don’t blindly trust it when Treasury yields are sitting above 5%. The tape is risk-on, yes. Bitcoin is bid, Ethereum is stronger, DXY is softer, and VIX has cooled. Still, the US 10Y Treasury yield at 5.108% keeps the market honest. Expensive money can cap enthusiasm quickly when macro data turns against positioning.
Dow Jones Analysis Snapshot: DJIA Outperforms At 52,178
DJIA rises 1.1% intraday, making it today’s strongest major US index mover
The Dow’s 1.1% intraday gain to 52,178 stands out because it is leading from the front, not being dragged higher by a broad tech impulse. In index work, that distinction matters. A Dow-led bid often points to money rotating into companies with more direct exposure to real-economy demand, pricing power, balance sheets, dividends, industrial activity, and cyclical earnings.
That doesn’t make the move automatically durable. It does make it tradable. When the Dow leads while volatility compresses, traders should watch whether the bid gets accepted above the prior intraday range or whether it becomes a late-session liquidity grab. I’ll take a selective risk-on market seriously, but I still want confirmation from structure.
S&P 500 gains 0.3% at 7,744 while Nasdaq adds only 0.1% at 26,713
The S&P 500 is higher by 0.3% at 7,744, while the Nasdaq Composite is up just 0.1% at 26,713. That’s a clear message. The market is participating, but it isn’t chasing mega-cap growth with both hands. This is not the typical high-beta, everything-rips tape that traders often associate with a broad risk-on market.
For readers tracking wider equity conditions, I’d compare this session with more market analysis rather than isolating the Dow alone. Index leadership rotates. When the Dow is hot and Nasdaq is flat, the question becomes whether money managers are reducing growth concentration or simply adding exposure where valuations look less stretched.
Dow-led strength signals rotation into industrial and value-linked exposure rather than a broad tech chase
My clear opinion: Dow leadership is cleaner than Nasdaq leadership right now because it suggests participation outside the crowded growth trade. That doesn’t mean tech is weak. It means the marginal dollar is acting more selective. Value, industrials, financial sensitivity, and old-economy cash flow are getting attention.
After 12 years watching forex, crypto, and index flows, I’ve learned that rotation matters most when it happens near macro catalysts. Markets often rebalance before the data, not after it. CPI retail sales, yields, and oil can all change the quality of today’s bid. A strong Dow close would be constructive, but the context around that close matters more than the green number.
Why Is The Dow Leading The Risk-On Market?
VIX drops 3.1% to 15.95, improving equity bid conditions and reducing hedging pressure
The VIX is down 3.1% at 15.95, and that is supportive for equities. Lower implied volatility reduces the urgency to hedge, which can free up buying power and support dealer flows. In practical terms, calmer volatility can help indexes hold gains with less resistance from options-related pressure.
Still, VIX below 16 is not a permanent permission slip. Volatility is a condition, not a guarantee. When the market has CPI, retail sales, and elevated Treasury yields in the same field of view, low volatility can also mean complacency. I want to see whether the Dow holds above the 52,000 area once traders have had time to digest the move.
Sector rotation favors cash-flow and cyclical names as investors seek participation outside mega-cap tech
The stronger Dow tape suggests investors want equity exposure, but with a different flavor. The appetite is there. The allocation route is changing. Instead of piling only into duration-heavy tech, the market is showing interest in companies tied to manufacturing, infrastructure, consumer activity, and credit conditions.
That rotation fits a risk-on market with boundaries. The US Dollar Index is softer at 101.78, EUR/USD is firmer at 1.1244, GBP/USD is stronger at 1.3334, and crypto is bid with Bitcoin near 81,970 and Ethereum at 2,461. Those cross-asset signals lean constructive. The complication is still rates. A 5.108% 10Y yield can quickly challenge equity multiples when data runs hot.
Lower volatility supports upside liquidity, but confirmation requires sustained acceptance above current Dow strength
Lower volatility helps stock market liquidity, but acceptance is the real test. I define acceptance as time spent above a key area, clean closes, and follow-through that doesn’t immediately unwind after a stop-run. The Dow has printed 52,178, which puts the 52,000 region in play as a near-term reference point.
For traders using SMC trading strategies, the focus is less about predicting the next candle and more about reading intent. A healthy continuation usually shows expansion away from a liquidity pool, not a choppy drift that keeps returning to the same stops. The market has made a statement. Now it needs to defend it.
How Do CPI Retail Sales And Treasury Yields Shape The DJIA Forecast?
US 10Y Treasury yield holds at 5.108%, keeping rate sensitivity elevated into macro data
The US 10Y Treasury yield at 5.108% is the main restraint on the DJIA forecast. Equities can rally with high yields for a while, especially when earnings expectations are stable and volatility is falling. But the higher the yield floor, the more sensitive valuation becomes to inflation surprises, retail demand, and Fed pricing.
Investing.com Canada has highlighted CPI and retail sales as key items on Wall Street’s busy calendar, and that framing is correct. Those releases can shift the market’s view of inflation persistence and consumer strength in one shot. Strong demand with sticky inflation can be a problem. Softer demand with falling price pressure may be friendlier for liquidity.
CPI retail sales releases define whether stock market liquidity expands or contracts
CPI retail sales data matter because they influence the price of liquidity. A cooler inflation read can ease rate pressure and help equity buyers justify continued exposure. A hotter print can push yields higher, tighten financial conditions, and force traders to reduce risk. Retail sales add another layer because they reveal whether the consumer is still carrying nominal growth.
For the Dow, that mix is especially important. The index has more sensitivity to cyclical business conditions than a pure growth benchmark. A constructive CPI and retail sales combination could support the current bid. A hostile combination could expose today’s strength as premature positioning rather than durable accumulation.
Hot data could pressure valuations, while softer data may reinforce risk-on positioning
Equity traders don’t need perfect data. They need data that keeps liquidity available. Hot CPI with strong retail sales may sound positive for the economy, but markets can read it as a reason for yields to stay higher for longer. Softer CPI with manageable retail sales would be easier for risk assets to absorb.
That is the balance behind the current DJIA forecast. The Dow can keep leading while volatility falls and the dollar softens, but it needs yields to stop pushing against the trade. High yields do not kill every rally. They make weak rallies easier to expose.
Stock Market Liquidity: What VIX And Oil Are Signaling
WTI crude slips 0.3% to $97.63, easing some inflation anxiety but not removing CPI risk
WTI crude is down 0.3% at $97.63. That small slip helps the inflation narrative at the margin, but oil near the high 90s is still expensive enough to matter. Energy prices feed into inflation expectations, margins, transportation costs, and consumer psychology. One red tick in crude does not remove CPI risk.
Investing.com reported that shares were cautious in Asia as earnings loomed and oil slipped, which lines up with the current cross-market tone. Traders are willing to take risk, but they are not ignoring macro friction. For a deeper energy backdrop, the recent WTI crude analysis around yield pressure is worth pairing with the Dow setup.
Cooling volatility and softer oil create a better backdrop for equity liquidity
Lower VIX and softer oil can help equity liquidity because they reduce two common pressure points: hedging demand and inflation anxiety. Add a softer DXY, and the environment becomes easier for risk assets to breathe. Gold is also firm at 4,197, which tells me some traders still want protection even while equities rise.
That mixed message is normal near big data. Risk appetite can improve while defensive demand remains alive. I’d rather see that than a one-way euphoric tape, because cleaner rotations often give better structure for serious traders. For metals context, the gold price analysis near the 4,200 area gives a useful read on why haven and inflation hedges still matter.
Liquidity remains event-driven because Treasury yields are still high enough to challenge continuation
Stock market liquidity is positive, but it is event-driven. That means the market can look healthy for hours, then reprice aggressively after one macro release or yield spike. The 10Y at 5.108% keeps pressure on duration, credit appetite, and equity valuation math.
StoneX has also framed the Dow setup around oil slipping and Treasury yields pausing. That is the right relationship to monitor. The Dow can extend when yields stop climbing. It becomes more fragile when yields resume pushing higher while volatility starts to wake up.
SMC Trading Plan: 52,000 Area And Liquidity Sweeps
Watch whether DJIA sustains trade above the 52,000 area after printing 52,178 intraday
The 52,000 area is the obvious near-term line on my chart. Price has already traded above it with the Dow at 52,178, so the issue is not whether buyers can touch the level. The issue is whether they can keep control around it.
In SMC terms, a round-number break often attracts late buyers and stop orders. That makes the area useful, but dangerous. I don’t want to chase a stretched candle into a liquidity pocket. I want to see whether the market accepts above 52,000, pulls back in a controlled way, and then expands with intent.
A raid into nearby sell-side liquidity followed by displacement would favor continuation
A constructive sequence would be a controlled dip below a short-term low, a quick raid of sell-side liquidity, and then a decisive reclaim with strong displacement. That type of pattern tells me sellers were used as fuel rather than allowed to take control.
For the Dow, the cleanest bullish behavior would involve price holding the broader 52,000 region after a shakeout. That would suggest the move has more behind it than headline buying. No setup is certain, but clean expansion after a stop-run gives traders a defined structure to work with.
Failure to hold post-sweep expansion may imply the move was liquidity engineering, not institutional accumulation
The danger is a sweep that fails. Price can raid liquidity, push above a visible level, attract breakout buyers, and then reverse sharply. That is where many retail traders get trapped because they read the break but ignore the response.
I care more about what happens after the raid than the raid itself. A failed hold above 52,000 would make me question the quality of the rally, especially with CPI retail sales and yields still hanging over the tape. Strong markets don’t need endless excuses. They hold reclaimed ground and force underpositioned traders to chase.
My read: the Dow is leading a real risk-on rotation, but the trade is still macro-sensitive. Above 52,000, buyers have a valid case. Below failed post-sweep structure, caution comes back fast.
Bullish And Bearish Scenarios For The Dow Jones
Bullish case: clean acceptance above current Dow strength with VIX staying subdued
The bullish case is straightforward. The Dow continues to hold above the 52,000 area, VIX remains subdued near the mid-teens, oil stays contained, and Treasury yields stop pressing higher. That combination would support further equity participation and could keep the Dow ahead of the S&P 500 and Nasdaq in the near term.
Strong acceptance would also validate the rotation theme. Traders would be seeing more than a one-session pop. They would be seeing capital stay committed to value and cyclical exposure while volatility remains soft.
Bearish case: CPI or retail sales shocks lift Treasury yields and trigger a sweep-and-reject pattern
The bearish case centers on data. A hot CPI or retail sales shock could push Treasury yields higher and challenge equity valuations. That would be especially relevant with the 10Y already at 5.108%.
If price were to sweep above a visible intraday high and then reject back below 52,000, I’d treat that as a warning. The move would look less like institutional accumulation and more like liquidity engineering. In that environment, chasing strength becomes low-quality behavior.
Neutral case: DJIA remains bid but liquidity thins as traders wait for macro confirmation
The neutral path may be the most realistic before the next major data point. The Dow can remain bid, but ranges may get more uneven as traders wait for confirmation from CPI retail sales and the bond market. That kind of tape often produces false starts in both directions.
For serious traders, patience is a position. A market sitting near highs with mixed cross-asset signals does not require constant action. Let the Dow show whether 52,000 becomes support or just another liquidity marker on the way to a deeper reset.
FAQ
What is the main takeaway from today’s Dow Jones analysis?
The Dow is leading the US index complex, trading at 52,178 and up 1.1% intraday. The move reflects risk-on rotation, supported by a lower VIX, while the S&P 500 and Nasdaq lag. The key question is whether this is true expansion or a liquidity sweep.
Why is the DJIA outperforming the S&P 500 and Nasdaq?
DJIA strength suggests rotation into value, industrial, and cyclical exposure instead of a broad tech-led rally. The S&P 500 is up 0.3% and Nasdaq only 0.1%, so the market is not chasing growth aggressively. That makes Dow leadership important for the near-term DJIA forecast.
How do CPI retail sales data affect stock market liquidity?
CPI retail sales data can shift rate expectations and liquidity quickly. With the US 10Y yield at 5.108%, markets remain sensitive to inflation and consumer demand surprises. Softer data may help risk assets, while hotter data could tighten liquidity and pressure equities.
What does a lower VIX mean for the risk-on market?
A lower VIX usually signals reduced hedging demand and calmer equity conditions. Today’s 3.1% drop to 15.95 supports risk-on behavior and makes upside participation easier. However, volatility can return quickly if CPI, retail sales, or Treasury yields surprise against equity positioning.
What should SMC traders watch on the Dow near 52,000?
SMC traders should monitor whether DJIA maintains acceptance above the 52,000 area or raids nearby sell-side liquidity before continuing higher. A strong displacement after a sweep supports continuation. A rejection would suggest the move was a liquidity grab rather than institutional expansion.
The forward read is simple: the Dow has earned attention at 52,178, but the next answer comes from acceptance above 52,000, VIX behavior, and whether CPI retail sales let liquidity keep flowing. Are you treating this as real rotation, or a stop-run waiting to fade?
Disclaimer: This analysis is for educational purposes only and is not financial advice or a recommendation to buy or sell any market.