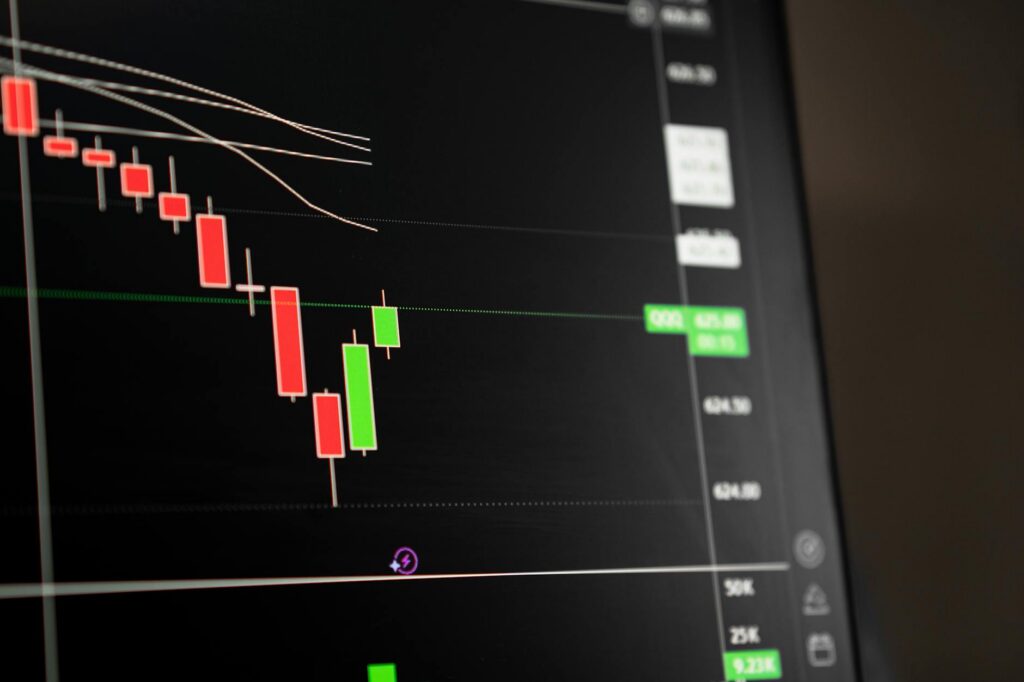
BTC is sitting near $62,177 after a 7.0% 24-hour drop, and the phrase saylor sells bitcoin is doing exactly what a loaded headline does during a selloff: it adds emotion to an already weak tape. I don’t care how loud the narrative gets. The trade still has to come from price, liquidity, and structure.
The market is close enough to $60,000 that every candle matters now. A lazy short into the hole can get squeezed. A lazy dip-buy can get run over. The better job is to map the levels, watch how price behaves when liquidity gets taken, and execute only when BTC gives a reason.
Why Does Saylor Sells Bitcoin Matter for Sentiment?
Institutional selling is context, not a short signal
The market treats Michael Saylor and Strategy as a proxy for institutional Bitcoin conviction. That’s why a report that Saylor sold Bitcoin for the first time since 2022 hits sentiment harder than a normal wallet movement. Traders read it as a possible shift in behavior from one of the most visible corporate BTC holders.
That said, context isn’t execution. A sale, especially if modest relative to total holdings, doesn’t automatically mean capitulation. It means traders need to respect the possibility of bitcoin institutional selling pressure and the emotional reaction that follows. The chart decides whether that pressure becomes continuation or gets absorbed.
My clear opinion: shorting BTC just because a scary institutional headline crossed the tape is poor trade location. Headlines create urgency. Smart money uses urgency for liquidity.
Fear gets amplified when the market is already falling
The timing matters. BTC is already down 7.0% over 24 hours near $62,177, so traders aren’t processing the Saylor news from a position of confidence. They’re processing it while stops are being hit, leverage is being unwound, and late buyers are staring at failed support.
That combination can increase volatility. A narrative shock during a clean uptrend often becomes noise. The same shock during a breakdown can accelerate selling because it confirms what nervous traders already fear. I’ve seen this pattern often enough in crypto and FX: the headline doesn’t need to be large in fundamental size to produce a large reaction when positioning is fragile.
Headlines must be separated from tradable structure
The clean way to handle this is to separate story from execution. The story is that a high-profile Bitcoin bull reportedly sold, and traders are talking about institutional supply. The execution question is narrower: can BTC hold the next downside liquidity zones, or does every bounce fail into resistance?
For more background work around BTC setups, I’d keep a close watch on more bitcoin analysis, because this market is now trading level to level. Bias can help. Precision pays.
Where Is BTC Trading After the 7% Drop?
$62,177 is the baseline for execution
All current analysis in this piece is anchored to BTC near $62,177, down 7.0% in 24 hours. That matters because traders love stale levels. A zone that looked far away two sessions ago is now actionable. A target that sounded dramatic yesterday may now be ordinary market rotation.
From this spot price, $60,800 to $60,000 is close enough to matter immediately. The upside levels at $63,500 and $65,800 are also close enough to define whether sellers keep control or begin losing their grip.
Bitcoin price analysis beats panic headlines
Good bitcoin price analysis starts with the live tape, not with the loudest social media post. BTC has already displaced lower, so the question is no longer whether the market is weak. It is weak. The better question is whether weakness is mature or still expanding.
That’s why I’m more interested in how price trades into $60,800 to $60,000 than in arguing about the headline. A controlled move into liquidity followed by absorption and a strong expansion away from the zone creates a very different setup than a direct breakdown through $60,000 with no meaningful response.
For traders who want a deeper playbook around that exact area, the prior guide on trading the $60K Bitcoin sweep is directly relevant here.
ETH confirms weakness across majors
ETH near $1,756 confirms that this isn’t isolated BTC noise. When Ethereum is weak alongside Bitcoin, the market is usually dealing with broad crypto de-risking rather than a single-asset rotation.
That doesn’t mean everything must keep falling in a straight line. It does mean dip buyers need stronger evidence. A BTC bounce while ETH remains heavy can be a lower-quality rally. A synchronized recovery across majors would give bulls a better foundation.
Downside Liquidity Zones Below $62,177
$60,800 to $60,000 is the first real downside pool
With BTC near $62,177, the $60,800 to $60,000 band sits roughly 2.2% to 3.5% below spot. That’s close. It is also obvious, which makes it dangerous.
Round numbers attract attention. Stops often sit below them. Limit bids cluster around them. Breakout shorts wait beneath them. That mix creates liquidity. The market can trade into the zone, trigger a reaction, and still leave both early longs and late shorts trapped depending on how the next candles print.
These btc support levels should be treated as reaction zones, not automatic buy buttons. Support is only useful after the market proves that buyers are defending it or sellers are failing to follow through.
$58,800 to $57,500 becomes practical after a clean $60,000 loss
The next downside area I care about is $58,800 to $57,500. That zone is still within range of the current $62,177 spot, but it should not be treated as inevitable. It becomes far more relevant after BTC loses $60,000 cleanly and fails to reclaim it.
A clean loss means more than a wick. I want to see acceptance below the level, failed recovery attempts, and continued downside expansion. Without that, a move below $60,000 can become a liquidity raid rather than a trend continuation.
CoinDesk recently framed the market around the risk of BTC retesting the February $60,000 low area, which matches the level traders are watching now. The useful takeaway from that Bitcoin market coverage is simple: $60,000 is no longer a distant reference point. It is part of the live battlefield.
Reaction zones require evidence
A lot of traders confuse “price is near support” with “I should buy.” That mindset gets punished in high-volatility selloffs. BTC can pause at a level, print a small bounce, and then continue lower once fresh longs are trapped.
The better read is behavioral. Does BTC sweep below a level and immediately recover? Are sell candles getting smaller? Does volume show aggressive selling with poor downside progress? Does a lower-timeframe shift appear after the raid? Those details matter more than the line itself.
What Would Prove Sellers Are Losing Control?
$63,500 is the first warning for bears
The first upside level I’m watching is $63,500. A reclaim there would be the first sign that bitcoin bearish momentum is weakening. It would tell me that sellers who pressed the breakdown are no longer getting clean continuation.
That doesn’t instantly make the chart bullish. It does change the quality of shorts. Below $63,500, rallies can still be treated as potential lower-high formations. Above it, especially with acceptance, late shorts are exposed to a squeeze back toward the next resistance pocket.
$65,800 is stronger bearish invalidation
The more important invalidation zone is $65,800. A strong push into that area would challenge the short-biased structure more directly because it would show buyers reclaiming a higher section of the breakdown range.
For me, $65,800 is where bearish setups need to become more selective. Chasing shorts below that level can work during strong trend days, but once BTC recaptures higher resistance and holds it, the risk-reward profile changes. Sellers are no longer attacking from strength. They’re defending against recovery.
Acceptance matters more than one wick
A single wick above resistance is cheap information. Acceptance is better information. I want to see price trade above a level, hold above it, and reject attempts to push it back below.
That distinction keeps traders from overreacting to stop-runs. BTC loves to stab above resistance, pull in breakout longs, and reverse. It also loves to wick below support, trigger panic selling, and reclaim. The level matters, but the response after the level matters more.
Bitcoin Market Structure After the $62K Breakdown
Lower highs, downside expansion, and obvious liquidity
The current bitcoin market structure is damaged. BTC has printed lower highs, delivered downside expansion, and moved closer to well-advertised liquidity around $60,800 to $60,000. That combination favors sellers until proven otherwise.
Kitco recently described Bitcoin’s bearish momentum as accelerating, and that description fits the live structure while BTC trades near $62,177 after a 7.0% slide. The useful part of that market analysis is the momentum read, not a blind instruction to sell every candle.
Structure gives bias. Execution still needs timing.
Continuation risk versus relief bounce risk
Intraday continuation risk remains real because sellers have momentum and the nearest downside liquidity is attractive. A fast drive into $60,800 to $60,000 would not surprise me. The market has already shown enough weakness to justify that path.
At the same time, BTC is stretched on a short-term basis after the 24-hour decline. That creates relief-bounce risk, especially once obvious stops get triggered. Late shorts often enter after the easy part of the move. When price snaps back, they become fuel.
That’s why I don’t like emotional entries here. The trader who waits for the raid, the reaction, and the lower-timeframe shift usually gets a cleaner stop and a clearer target. For broader process work, the site’s trading strategies and guides section is useful when markets get this reactive.
Bearish continuation and liquidity sweep reversal are different trades
A bearish continuation setup usually shows acceptance below a key level, weak reclaim attempts, and fresh selling from a lower-high zone. In that case, support has failed and the market is repricing lower.
A liquidity sweep reversal looks different. BTC trades through a known level, triggers stops, fails to continue, and then expands back above the swept area. That pattern traps breakdown shorts and can produce a sharp bounce, especially when the level is as visible as $60,000.
The mistake is treating both setups the same. A break is not always continuation. A bounce is not always reversal. The market structure around the event decides which side has control.
SMC Execution Plan: Sweep, Displacement, Confirmation
Wait for the raid before committing
My SMC plan is simple: don’t pay for bad location. Near downside levels, I want the market to take liquidity first. That can mean a push below $60,800, a probe through $60,000, or a stop-run into a lower pocket like $58,800 to $57,500 after $60,000 fails.
Buying before the raid leaves the stop exposed. Shorting directly into the level after a large drop often means selling to better-positioned traders. Patience is not passive here. It is part of the edge.
Expansion away from the swept zone is the tell
After liquidity is taken, I want displacement away from the zone. For a long, that means BTC raids lower, fails to continue, then prints strong bullish candles back above the level. For a short, price may reclaim a level briefly, fail to hold, and then expand lower with urgency.
The candle quality matters. Slow, overlapping chop is hesitation. Clean expansion shows intent. I also want the move to break a minor internal structure point, because without that shift, the reaction may be nothing more than a pause before another leg lower.
Lower-timeframe confirmation controls risk
The lower timeframe is where risk gets refined. I’m looking for a small structure shift, a fair value gap or imbalance that price respects, and a stop that belongs beyond the liquidity event rather than in the middle of noise.
Targets should be practical. From a bullish reaction near $60,000, the first upside magnet is the prior breakdown area around $63,500. A stronger recovery can look toward $65,800. From a bearish continuation below $60,000, $58,800 to $57,500 becomes the cleaner downside map.
For traders building a full SMC playbook, the strategy guides are worth reviewing before taking high-volatility crypto trades. The goal is not to predict every tick. The goal is to stop donating money in the worst possible locations.
FAQ
Did Saylor sell Bitcoin, and should traders short BTC because of it?
Saylor selling Bitcoin is a major sentiment shock because it signals potential bitcoin institutional selling pressure. However, it should not be treated as a standalone short signal. Traders should wait for price to confirm with structure, liquidity sweeps, displacement, and lower-timeframe execution triggers.
What are the key BTC levels after the $62K breakdown?
With BTC near $62,177, the first meaningful downside liquidity zone is $60,800 to $60,000. Should $60,000 break cleanly, the next practical downside area is $58,800 to $57,500. On the upside, $63,500 is the first reclaim level, while $65,800 is stronger bearish invalidation.
Is $60,000 Bitcoin support right now?
At a $62,177 spot price, $60,000 is not yet a confirmed reaction level in this move. It is a nearby downside liquidity zone that may act as support only after price reaches it and shows absorption, stop-run behavior, displacement, or a clear bullish response.
What would invalidate bitcoin bearish momentum?
A reclaim of $63,500 would be the first warning that sellers are losing control. The stronger invalidation zone is $65,800, where bearish market structure would be challenged more directly. Until then, rallies can still be treated as potential lower-high formations.
How should SMC traders approach buying the dip or shorting support?
SMC traders should avoid entering just because price is near a level. The cleaner process is to wait for a liquidity sweep, then watch for displacement and lower-timeframe confirmation. That helps separate a real reversal from a continuation move through weak support.
BTC is close to the levels that decide the next tradeable leg. I’m watching whether $60,800 to $60,000 produces absorption or gives way, and whether any bounce can reclaim $63,500 with acceptance. Which side are you waiting for: the sweep-and-reclaim, or the clean break lower?
Disclaimer: This article is for educational purposes only and is not financial advice. Crypto trading involves substantial risk, and you are responsible for your own decisions.


