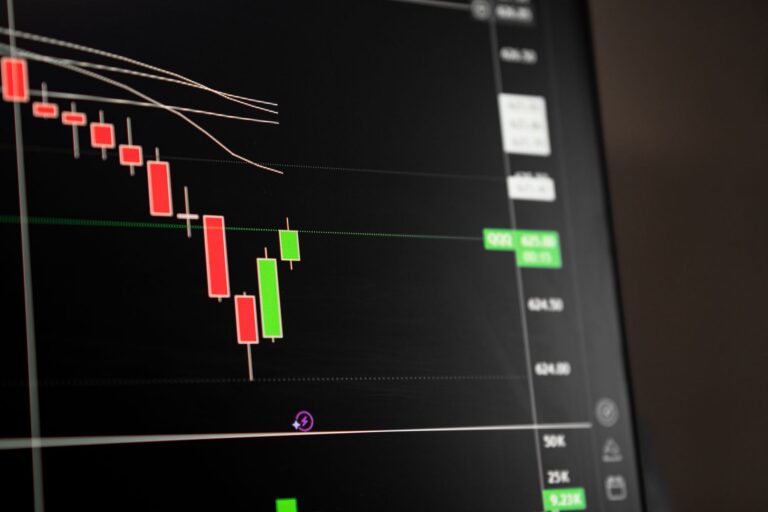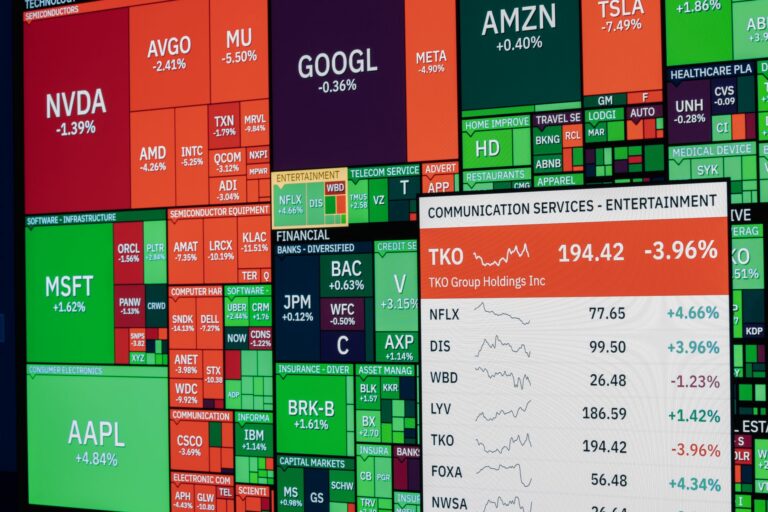
WTI crude oil analysis starts with a simple fact on the tape: WTI is trading near $82.40, up 1.4% intraday, while equities are soft and Treasury yields are rising. That combination tells me crude is carrying a supply premium, not just drifting with the broader commodity complex. Gold is firmer at $4,432, but oil is the cleaner mover. The market is reacting to Trump-Iran tension, pricing fresh disruption risk, and forcing traders to respect energy as the lead macro impulse.
WTI Leads Today’s Cross-Market Tape
Oil price today: WTI trades near $82.40, up 1.4% intraday
The oil price today matters because WTI is not moving in isolation. At $82.40, crude is pushing higher while the S&P 500 trades near 7,786, down 0.2%, the Nasdaq Composite sits around 26,729, down 0.3%, and the Dow is lower by 0.2% near 53,732. That is not panic, but it is defensive enough to show a shift in appetite.
When crude rises during a softer equity session, I treat it differently than a normal risk-on commodity bid. A broad reflation tape usually lifts oil, copper, equities, and high beta together. Here, crude is outperforming while risk assets fade. That is a supply-risk signature.
For traders tracking broader flows, this is the kind of session where more market analysis helps because the strongest asset often carries the cleanest information. Right now, that asset is WTI.
Why crude is the strongest allowed mover in the current macro tape
The word “allowed” is intentional. Some markets are boxed in. The dollar index is softer near 99.64, down 0.3%, but EUR/USD and GBP/USD are barely moving. Bitcoin is flat near $62,964, and Ethereum is lower by 0.2% near $1,878. Even volatility is not confirming stress, with VIX down 2.6% at 14.25.
WTI has room to move because the catalyst is specific. Supply headlines can reprice oil faster than they reprice equities or FX. Traders do not need a full macro reset to lift crude. They only need a higher probability of disruption, shipping risk, sanctions pressure, or production uncertainty.
That is why I do not dismiss a 1.4% intraday move in oil as noise. In a mixed regime, the cleanest directional asset deserves attention. WTI has that role right now.
How the rally contrasts with softer equities and higher yields
Equities are not collapsing, but they are not confirming the oil rally either. The S&P 500, Nasdaq, and Dow are all modestly red. Meanwhile, the U.S. 10Y Treasury yield is up 1.1% to 4.692%. Higher yields plus higher crude is a difficult mix for long-duration equities.
That matters because oil strength can become an inflation impulse. Equity traders may initially ignore a crude spike, especially when VIX is lower, but the bond market usually pays attention faster. A higher energy complex can push inflation expectations around, and that can bleed into Fed pricing.
External live-market coverage has also tied the equity weakness and oil strength to Trump-Iran tensions and shifting rate expectations, including reports from Sunday Guardian Live. I would treat those headlines as context, not as a trading system. Price still has to confirm.
Why Is WTI Crude Oil Rising Today?
Trump-Iran headlines revive crude oil supply risk
The main driver is crude oil supply risk. Trump-Iran headlines have revived concern that supply conditions could become less stable. The market does not need barrels to be physically removed today to price risk. Oil often moves first on probability, then adjusts later when the facts either confirm or fade.
That is the point many traders miss. Geopolitical oil rallies are rarely clean. They gap, sweep liquidity, pause, and sometimes reverse violently when the headline premium cools. But the first move still matters because it exposes where positioning is vulnerable.
My opinion is direct: when geopolitics is the catalyst, technical levels matter more, not less. The news creates the impulse. The chart tells us whether institutions are accepting higher value or simply running stops above obvious levels.
Supply premium expands as traders price disruption risk
A supply premium is the extra price traders are willing to pay because future supply might be tighter, more expensive, or harder to transport. With WTI near $82.40, the market is adding that premium quickly, but not in a disorderly way. The move is firm rather than euphoric.
I have watched this pattern for years across crude and FX risk events: the first bid is usually emotional, but the second bid is the one that matters. After the initial headline reaction, serious money looks for acceptance. Does price hold above the breakout area? Does a pullback attract demand? Does volume expand near highs or dry up?
Those questions matter more than arguing whether the headline is “priced in.” Most traders use that phrase too loosely. A risk premium can stay embedded for longer than expected when the market has no clear reason to remove it.
Inflation-sensitive assets react as energy leads the move
Gold is up 0.3% near $4,432, which fits the inflation and uncertainty angle. The dollar is weaker, which normally helps commodities, but WTI is still the standout because the move is tied to supply rather than only currency translation.
Rates are the key cross-check. The 10Y yield at 4.692% is rising on the same tape where crude is higher. That combination tells me the market is at least considering the inflation channel. Energy-led inflation is not the same as wage inflation or services inflation, but it can still change the psychology around central bank patience.
For a wider macro read, I would compare this crude move against the dollar backdrop using DXY analysis focused on Fed expectations. A falling dollar can support oil, but the stronger message today comes from supply pressure.
How Is Oil Strength Affecting Risk Appetite?
S&P 500 down 0.2%, Nasdaq down 0.3%, and Dow down 0.2%
The equity tape is soft, not broken. S&P 500 at 7,786, Nasdaq at 26,729, and Dow at 53,732 show mild selling pressure. That said, the character matters. Oil is green, yields are higher, and equities are lower. That is enough to create a cautious backdrop for intraday traders.
Nasdaq usually feels this fastest because higher yields pressure growth multiples. The index is only down 0.3%, so I am not calling it a liquidation. But the relative weakness compared with crude says capital is being selective. Energy exposure is being rewarded, while broad equity beta is not.
Readers following tech risk can compare the current tape with Nasdaq analysis around yields and VIX. The relationship between rates, volatility, and growth stocks is still one of the cleanest cross-market tells.
U.S. 10Y Treasury yield rises 1.1% to 4.692%
The 10Y yield move is the pressure point. A 1.1% intraday rise to 4.692% is not extreme, but it reinforces the message from crude. Higher energy prices can make the bond market less comfortable with aggressive rate-cut assumptions.
That does not mean every oil rally becomes a rates shock. It means traders should stop treating crude as a side chart. When WTI leads and yields follow, equity risk can get heavy even without a volatility spike.
Market update services such as TS2 live stock market coverage often capture these cross-asset shifts in real time, but my process stays the same: identify the lead asset, map the liquidity, then wait for confirmation.
Higher oil and yields reinforce risk off trading conditions
Risk off trading does not always look dramatic. Sometimes it is a quiet rotation: crude up, yields up, equities down, crypto flat, volatility muted. That is the current mix.
What makes this tape tricky is the lower VIX. A falling VIX can tempt traders into assuming conditions are calm. I would be careful with that read. VIX is an equity volatility measure, not a full macro stress gauge. Oil can carry its own volatility cycle before equities wake up.
My read: WTI is the macro messenger right now. As long as crude holds firm above nearby demand, risk appetite stays vulnerable to another leg of inflation and supply-risk repricing.
WTI Crude Oil Analysis: Smart Money Concepts Levels To Watch
Liquidity above $83.00 is the key upside draw
From a WTI smart money concepts perspective, the obvious draw is liquidity above $83.00. Round numbers attract stops, breakout orders, and short-term momentum positioning. With spot near $82.40, that level is close enough to matter immediately.
I would expect resting buy stops above $83.00 from shorts who faded the earlier rally, plus breakout orders from late longs waiting for confirmation. That combination can create a fast push through the level. The quality of the move after the grab is what matters.
For traders newer to this framework, SMC trading strategies can help separate a real displacement from a simple liquidity raid. The difference is acceptance, not the wick itself.
A sweep above $83.00 without acceptance could trap late breakout buyers
A raid above $83.00 that immediately rejects would be a warning. Late buyers would enter on the breakout, stops would be triggered, and then price could slip back under the level. That is how a bullish-looking move becomes fuel for a reversal.
The key is not whether WTI trades above $83.00 for a few seconds or minutes. The key is whether it can hold there, build value, and avoid falling back into the prior range. A failed hold would put focus back on the nearest demand zone around $81.20 to $81.60.
Markets.com provides broad technical coverage across FX, indices, and commodities, and its general technical analysis section is a useful reminder that levels only matter when paired with price behavior. Static lines are not enough.
Acceptance above $83.00 opens a path toward $84.20 liquidity
Acceptance above $83.00 would shift the short-term objective toward $84.20 liquidity. That level sits within a reasonable extension from current price and would likely attract profit-taking from intraday longs. It may also pull in fresh buyers who only react after the market has already expanded.
A clean expansion through $83.00 should leave behind a visible imbalance or strong candle body. Price holding above that area on a retest would support continuation. Weak follow-through, overlapping candles, and fast rejection would argue for caution.
I prefer to see the market prove that buyers are willing to defend the new value area. Without that, a move toward $84.20 becomes more fragile and more dependent on the next headline.
Oil Market Structure: Bullish Until Proven Otherwise
Intraday structure remains constructive while price holds above the prior impulse base
The oil market structure remains constructive while WTI holds above the prior impulse base. Price is trading near $82.40 after a strong push, and the current structure favors buyers unless sellers can create a clean downside shift.
Structure is about control. Buyers currently have it because price is holding near the upper portion of the intraday range and has not given back the supply-risk impulse. That can change quickly in oil, but I do not front-run a reversal without evidence.
A typical mistake is shorting crude only because it feels extended. Extended markets can become more extended when the catalyst is supply risk. I would rather wait for a failed breakout, a demand failure, or a clear break in structure.
Near-term demand sits around $81.20-$81.60 on a pullback
Near-term demand sits around $81.20 to $81.60. That zone matters because it likely marks the area where the prior impulse began or where a fair value gap could attract dip buyers. With WTI at $82.40, that pullback would be meaningful without completely damaging the bullish case.
A controlled retracement into $81.20 to $81.60 could offer information. Strong buying from that area would show that the market still wants to defend the supply premium. A shallow reaction or heavy selling through it would say the bid is losing quality.
I would also watch gold during that pullback. Gold at $4,432 is modestly higher, and energy-led uncertainty can keep metals supported. The relationship is not mechanical, but gold SMC analysis around inflation catalysts can add useful context when crude and yields are both active.
A clean break below $80.50 would weaken the bullish intraday structure
The deeper line is $80.50. A clean break below that level would weaken the bullish intraday structure because it would show sellers have taken back more than a normal pullback. That would also suggest the supply premium is fading or being overwhelmed by profit-taking.
For now, $80.50 is not the active battleground. Price is much closer to $83.00 liquidity than to that downside invalidation zone. Still, serious traders define failure before they need it. Waiting until a position is under pressure to decide where the idea is wrong is bad process.
Below $80.50, the market would need to rebuild before I would call the tape bullish again. Until then, buyers still have the benefit of structure.
What Would Invalidate The Bullish WTI Crude Oil Analysis?
Failure to accept above $83.00 after a liquidity sweep
The first warning would be a sweep above $83.00 that fails to hold. That would show the market used the level to collect liquidity rather than establish higher value. In that case, late breakout buyers could be trapped, and the move back below $83.00 could become sharp.
I would not treat every rejection as a full bearish reversal. Oil can retest levels several times during headline-driven sessions. The difference is displacement. A hard rejection with expanding downside candles carries more weight than a shallow pause.
Loss of $81.20-$81.60 demand with impulsive selling
The second warning is a loss of $81.20 to $81.60 demand. That zone should attract buyers if the bullish structure is healthy. A slow drift into the area is one thing. Heavy selling through it is another.
Strong downside acceptance through that band would tell me buyers are no longer defending the prior impulse base. It would also increase the odds that the earlier rally was more stop-run than accumulation.
- Bullish behavior: pullback into demand, quick reaction, higher low formation.
- Neutral behavior: sideways trade between $81.60 and $83.00, no clear expansion.
- Bearish behavior: impulsive break through demand, weak retest, lower continuation.
Acceptance below $80.50 signaling a shift in control
The final invalidation is acceptance below $80.50. That would signal a shift in control from buyers to sellers on the intraday chart. It would not mean oil has entered a long-term bear trend, but it would weaken the current bullish setup.
At that point, I would stop leaning on the supply-premium narrative unless fresh headlines created another bid. Price leads the trade. Narrative explains the pressure, but structure determines whether the idea is still valid.
For now, WTI remains firm near $82.40, with $83.00 liquidity directly overhead and $81.20 to $81.60 acting as the first serious demand area underneath. The next clean signal likely comes from how price behaves at $83.00. Does crude accept higher, or does the market punish late buyers chasing the headline?
FAQ
What is the main driver of WTI crude oil today?
WTI crude oil is rising as Trump-Iran tensions revive concern over supply disruption risk. That geopolitical premium is lifting oil near $82.40, up 1.4% intraday, while traders price a higher probability of tighter or more volatile crude supply conditions.
How is the oil rally affecting equities and yields?
The oil rally is pressuring risk appetite because higher energy prices can feed inflation concerns. U.S. equities are softer, with the S&P 500 down 0.2%, Nasdaq down 0.3%, and Dow down 0.2%, while the 10Y yield is up to 4.692%.
What is the key WTI liquidity level to watch?
The key upside liquidity area is above $83.00. A move through that zone that fails to hold could trap late breakout buyers. Price acceptance above $83.00 would shift attention toward the next upside liquidity target near $84.20.
Where could WTI find demand on a pullback?
Near-term demand is likely around $81.20 to $81.60 if price pulls back into a fair value gap or prior impulse base. That zone matters because buyers may defend it to preserve the bullish intraday oil market structure.
What would weaken the bullish WTI crude oil analysis?
A clean break below $80.50 would weaken the bullish intraday structure and suggest sellers are regaining control. Before that, traders should watch whether price loses the $81.20 to $81.60 demand area with strong downside acceptance.
Disclaimer: This analysis is for educational purposes only and is not financial advice, investment advice, or a recommendation to buy or sell any asset.