WTI is sitting at $97.79, almost unchanged, and that flat print is the story. My WTI crude analysis starts with the simple fact that price is parked just under $98 while traders digest US-Iran mediation headlines, a supportive oil inventory draw narrative, and a risk-on macro tape that still carries a 5.090% 10-year yield. Crude is not trending cleanly here. It is coiling.
That matters because compression below a round liquidity level tends to punish lazy positioning. The market has enough bearish headline pressure to cap aggressive chasing, but enough supply risk to stop sellers from leaning too hard. When I see crude act like this near a clean figure, I treat the level as a dealing zone first and a breakout level second.
WTI Crude Analysis: What Is Price Signaling at $97.79?
Flat price action as a volatility warning, not a non-event
WTI at $97.79, down essentially 0.0%, looks quiet on the surface. I do not read it that way. A flat crude market near a visible level often means both sides are waiting for confirmation, and when confirmation arrives, the move can be abrupt.
The lack of direction is more useful than it looks. Buyers have not forced acceptance through $98. Sellers have not been able to press price meaningfully below the upper $97s. That balance tells me the market is still deciding whether mediation headlines deserve a larger discount or whether physical supply concerns deserve more respect.
For broader commodity and index context, I keep an eye on more market analysis because crude rarely trades in total isolation. Still, the current WTI setup is being driven less by generic risk mood and more by the battle between headline risk and barrel tightness.
Why the $97.50-$98.00 area is the current dealing range
The active range is tight: roughly $97.50 to $98.00. That half-dollar zone is where intraday buyers and sellers are currently negotiating value. Above $98, there is obvious buy-side liquidity from breakout orders and stops. Below $97.50, weaker longs who bought the upper range may start to get squeezed.
That makes the middle of the band a poor place to be emotional. I prefer to see how price behaves at the edges. A fast push into $98 that cannot hold tells me liquidity was taken but acceptance failed. A controlled bid above $98, followed by shallow pullbacks, tells a different story.
How compression near $98 turns oil liquidity into the main intraday driver
Oil liquidity is the main character around $98. Round numbers attract stops, breakout entries, option-related hedging, and short-term algorithms. The level is obvious, which is exactly why it matters.
Compression below a round figure can create two very different outcomes. The first is a buy-side raid that fades quickly, trapping late buyers. The second is a genuine breakout where the market recaptures the level and starts building value above it. The difference is follow-through. One spike is noise. Acceptance is information.
My read: WTI is not giving a clean directional signal yet. It is building pressure under $98, and the next real clue comes from whether that pressure releases into sustained trade above the figure or a failed stop-run.
Does US-Iran Mediation Remove Middle East Oil Risk?
How the preliminary mediation proposal pressures crude’s geopolitical premium
Reports that the US and Iran backed a preliminary mediation proposal have weighed on crude because the market prices geopolitical risk in probabilities, not certainties. A lower perceived chance of disruption can shave premium from oil quickly. Investing.com reported that crude fell after the US and Iran reportedly backed a preliminary mediation proposal, which helps explain why buyers are hesitating near $98 rather than attacking the level without friction according to the report.
That does not mean the geopolitical bid disappears. Mediation is a headline. Actual de-escalation requires follow-through, verified cooling in regional tension, and fewer threats to energy infrastructure or shipping lanes. Until then, middle east oil risk remains embedded in the tape.
Why unresolved regional tension keeps sellers from fully controlling WTI
Sellers have a good argument, but not full control. The bearish case is straightforward: less immediate conflict risk means less need to pay up for crude. The problem is that unresolved tension keeps the market from treating $98 as purely expensive.
This is the kind of environment where crude can refuse to break down even when the headline feels bearish. I have seen this pattern often in energy markets: the first headline creates a repricing, then price stalls because physical traders and macro funds want evidence before reducing the risk premium further. That is not a prediction. It is a market behavior worth respecting.
What headlines would confirm or weaken the Middle East oil risk bid
Confirmation of the risk bid would come from renewed shipping threats, attacks near key infrastructure, public breakdowns in talks, or language from officials that increases uncertainty around supply routes. Those headlines would make a push through $98 easier to justify.
The opposite would be verifiable progress in mediation, calmer regional language, and no signs of supply disruption. That would weaken the premium and leave WTI more exposed to a rotation back through $97.50. The tape does not need drama every hour, but it does need fresh urgency to keep geopolitical buyers engaged.
How Do Inventory Draws Offset Bearish Mediation Headlines?
Why an oil inventory draw supports the physical supply narrative
An oil inventory draw matters because it speaks to barrels, not headlines. Draws suggest either demand is stronger than expected, supply is tighter, exports are pulling barrels away, refinery behavior is changing, or some combination of those forces. For crude traders, that can be enough to stop a bearish headline from turning into a full trend day lower.
That is the tension under the current price. Mediation news pressures the premium. Inventory draw logic supports the physical market. WTI at $97.79 is caught between those narratives.
The difference between headline repricing and real barrel tightness
Headline repricing is fast. Real barrel tightness is slower, but often more durable. A diplomatic headline can move crude within minutes because funds adjust risk quickly. Physical tightness shows up through inventory data, spreads, refinery margins, export flows, and the way dips are absorbed.
My opinion is blunt: traders who ignore physical context in crude are trading half a market. Technicals matter. Smart Money Concepts matter. But oil is still a physical commodity, and the chart behaves differently when commercial demand is firm underneath.
Signals that inventory-led buying is gaining or losing traction
Inventory-led buying gains credibility when dips hold above prior intraday lows, pullbacks become shallow, and price starts spending time above $98 rather than merely tagging it. Stronger time spent above value is the tell.
That buying loses traction when rallies into the figure are rejected, volume fades on pushes higher, and price returns to the middle of the range without resistance. A failed reclaim of $98 would warn that the inventory story is supportive, but not strong enough by itself.
Macro Crosscurrents: Risk-On Equities, Yields, and DXY
S&P 500, Dow, and lower VIX show broader risk appetite
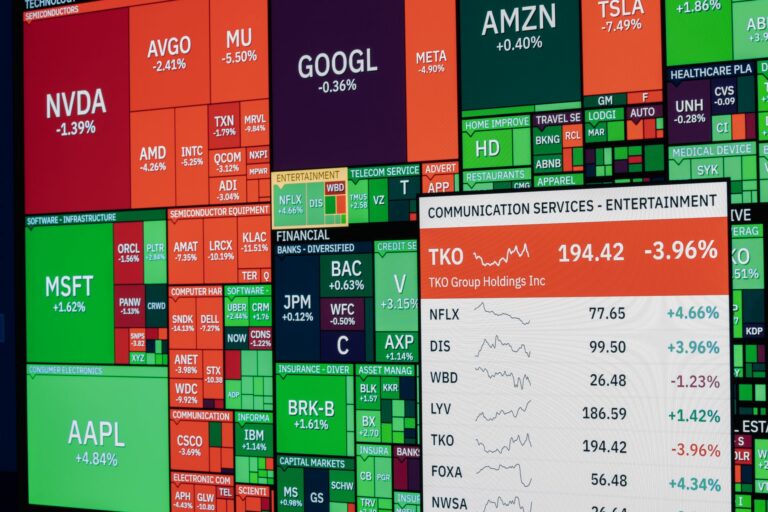
The wider market is leaning risk-on. The S&P 500 is up 0.3% at 7,713, the Dow is up 1.0% at 52,496, and the VIX is lower at 17.10. That backdrop usually helps cyclical assets because it points to calmer cross-asset conditions and less forced deleveraging.
Barchart reported that stocks finished mostly higher on earnings optimism, which matches the broader risk tone visible in the live snapshot in its market update. For related index context, the Dow Jones risk-on rotation is worth comparing with crude because stronger equities can support sentiment, even when oil has its own supply story.
Why the US 10-year yield at 5.090% is still a commodity demand headwind
The problem for oil bulls is the 10-year yield at 5.090%. Even with yields down 0.5% on the session, that is still a restrictive level. Higher yields tighten financial conditions, raise financing costs, and can weigh on future demand expectations.
Crude can rally with high yields when supply risk is strong enough. But absent fresh supply urgency, elevated rates make it harder for WTI to sustain a clean expansion above $98. That is why I do not want to chase a single wick through the level. I want acceptance.
Flat DXY at 101.67 keeps focus on geopolitics and supply, not dollar pressure
The US Dollar Index is flat at 101.67. That takes one major driver off center stage. A surging dollar would create a clearer headwind for dollar-priced commodities. A sliding dollar would offer a cleaner tailwind. Right now, neither side gets that help.
With DXY quiet, the focus returns to geopolitical premium, inventory behavior, and oil liquidity around the active range. Gold at $4,145.60 is slightly higher, crypto is bid with Bitcoin at $83,389, and equities are firm. The cross-asset message is risk appetite, but WTI still needs its own trigger.
Where Are the Key WTI Order Blocks and Liquidity Triggers?
Crude oil SMC map for the $97.50-$98.00 active range
From a crude oil SMC perspective, I map the current market in three parts: the $97.50-$98.00 dealing range, the buy-side liquidity above nearby highs, and the sell-side resting below the lower edge. For traders who want to go deeper into this framework, the site’s SMC trading strategies archive is the right place to build the foundation.
WTI order blocks around this zone matter only when price reacts from them with displacement. A marked block without reaction is just decoration. The useful areas are the last opposing candles before a strong move, especially when they sit near a liquidity grab or a prior imbalance.
Buy-side sweep above nearby highs that fails as a short trigger
A buy-side sweep above nearby highs, followed by a quick return under $98, would be a classic trap. Late breakout buyers get filled. Short stops are cleared. Then price slips back into the prior range, leaving the market heavy.
The short trigger is not the sweep alone. It is the failure after the sweep. I want to see price reclaim the range to the downside with some urgency, then respect a lower-timeframe supply zone on the retest. Without that, selling into a strong level becomes guesswork.
Clean acceptance above $98.00 as a signal toward higher liquidity
A clean hold above $98 changes the conversation. Acceptance means candles closing and building above the figure, pullbacks holding the level, and buyers defending it without needing constant headline support. That would point toward higher liquidity pools and force shorts to reassess.
The prior WTI setup around yields is also useful context because crude has been sensitive to rate pressure near liquidity levels. You can compare the current structure with this earlier WTI crude analysis around $96 liquidity and yields to see how quickly the driver mix can shift.
Trading Scenarios: Breakout Acceptance or Sell-Side Run?
Bullish case: hold above $98.00 and expand toward higher liquidity pools
The bullish scenario needs WTI to trade through $98 and stay there. A brief poke is not enough. Bulls want value to migrate higher, with $98 turning from resistance into support and pullbacks holding above the old range.
That would imply mediation headlines are being absorbed and inventory-led buying is gaining traction. The next targets would be the nearest liquidity pockets above the session highs, then any visible unfinished auction left from prior selling. I would still manage risk tightly because geopolitical markets can reverse on one headline.
Bearish case: rejection near $98 and rotation back into imbalance
The bearish scenario starts with a rejection near $98. Price raids the top, fails to build, then rotates back below $97.50. That would tell me the market used the round figure to collect orders before moving toward lower liquidity.
In that case, I would watch for imbalance to fill beneath the range and for buyers to show whether they can defend the next demand zone. A weak bounce after a failed breakout is often more informative than the first drop. It shows whether dip buyers still have conviction or whether they are trapped.
Risk management cues when crude oil SMC signals conflict with macro headlines
Crude oil SMC signals can conflict with macro news, and that is where discipline matters. A bullish order block means less when a credible de-escalation headline hits. A bearish liquidity sweep means less when fresh supply disruption enters the tape.
My process is to size smaller when technicals and headlines disagree. I would rather miss part of a move than pretend the chart is operating in a vacuum. In crude, stops need room for headline wicks, but they also need to be real. Moving risk farther away without reducing size is how traders turn a tactical idea into a problem.
The level to watch remains $98. WTI at $97.79 is close enough that the market does not need a huge catalyst. It needs confirmation. The next meaningful signal should come from acceptance above the figure or a failed grab that sends price back into the $97.50 area. Which side do you think takes control first, inventory buyers or headline sellers?
FAQ
What is the main takeaway from this WTI crude analysis?
The main takeaway is that WTI is coiling near $97.79, just below the $98 liquidity zone. Mediation headlines are pressuring geopolitical premium, but inventory draw narratives and Middle East tension are preventing a clean bearish break, leaving price trapped in a tactical dealing range.
How does US-Iran mediation affect crude oil prices?
US-Iran mediation can reduce the immediate risk premium because traders price lower odds of disruption. However, it does not erase Middle East oil risk unless tensions, shipping threats, and production concerns also cool. That is why WTI can stall instead of instantly selling off.
Why does an oil inventory draw matter for WTI?
An oil inventory draw suggests physical supply is tightening or demand is stronger than expected. In this setup, that narrative offsets bearish mediation headlines by limiting seller conviction. Traders should watch whether inventory-led buying can actually force acceptance above $98 rather than just create temporary bids.
What does crude oil SMC suggest around $98?
From a crude oil SMC view, the $97.50-$98.00 band is the active dealing range. A sweep above buy-side liquidity that fails can expose imbalance below. A clean hold above $98 would shift attention to higher liquidity pools and potential bullish continuation.
Is today’s WTI move driven by the US dollar?
Today’s flat DXY means WTI is not mainly reacting to dollar pressure. The higher US 10-year yield near 5.090% still matters because tighter financial conditions can weigh on commodity demand, making it harder for crude to rally without fresh supply-side urgency.
Disclaimer: This article is for educational purposes only and is not financial advice. Trading commodities involves risk, and you should make decisions based on your own plan, risk tolerance, and independent research.