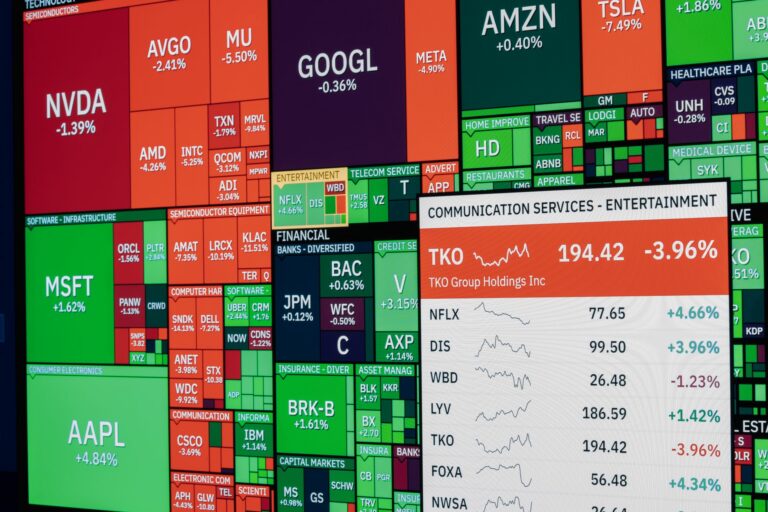
The Nasdaq Composite is trading near 25,520, down 1.4% intraday, and the tape feels heavier than a normal growth-stock dip. The Nasdaq selloff is coming with a 12.2% VIX spike to 18.77, oil pressing higher at $82.47, and chip stocks dragging the high-beta side of the board lower. That combination matters. When volatility rises while tech breaks lower, I stop treating weakness as an automatic buy-the-dip event and start reading the tape through risk control, liquidity, and market structure.
The broader board confirms the pressure. The S&P 500 is down 1.0% at 7,458, the Dow is lower by 0.8% at 52,146, and the regime has shifted firmly risk-off. For traders tracking broader cross-asset context, I’d keep an eye on more market analysis alongside index structure because the signal is not isolated to one crowded corner of tech.
Why Is The Nasdaq Selloff Accelerating Today?
Nasdaq Composite trades near 25,520, down 1.4% intraday
The first thing I care about is the quality of the move. A 1.4% drop in the Nasdaq Composite at 25,520 is enough to force action from systematic flows, momentum funds, and retail traders sitting in crowded growth names. It does not qualify as panic by itself, but it does change the intraday auction.
Price has moved from a two-way grind into downside expansion. That tells me sellers are not simply leaning on weak opens. They are getting follow-through. In Smart Money Concepts terms, the move lower has the look of displacement, meaning price has traveled aggressively enough to leave inefficient pockets that can matter on a retracement.
My clear view: the worst trade after a move like this is emotional chasing. The best trades usually come after price pulls back into a cleaner area, tests liquidity, or shows whether sellers still defend premium pricing.
S&P 500 at 7,458 and Dow at 52,146 confirm broad index pressure
The S&P 500 trading at 7,458, down 1.0%, and the Dow at 52,146, down 0.8%, tell us this is not only a Nasdaq problem. The Nasdaq is leading lower because it carries more growth and semiconductor exposure, but the weakness has spread far enough to confirm broad equity stress.
That matters because isolated Nasdaq weakness can reverse quickly when mega-cap buyers step in. Broad index pressure is different. It shows institutions are reducing exposure across the equity complex, not simply rotating from one tech pocket to another.
For session context, CNBC’s market coverage has been focused on the opening tone and cross-market pressure, which fits the live read across indexes and volatility. Traders can compare that broader tape with the current Nasdaq structure through CNBC’s Market Open coverage.
Crowded growth exposure faces forced de-risking in a risk-off market
A risk off market punishes crowded trades first. Growth exposure, AI-linked names, chip stocks, high-multiple software, and speculative tech all tend to carry the same problem during volatility expansion: too many holders with similar stop levels and similar risk models.
Once the Nasdaq starts falling and the VIX pushes higher, managers who were comfortable adding risk during calm conditions start trimming. Some sell because the thesis changed. More sell because volatility changes their allowable position size. That mechanical de-risking is what turns a normal pullback into a sharper index move.
I’ve seen this pattern across index and FX markets for years. When volatility expands quickly, traders who were relaxed about drawdown suddenly care about every tick. That emotional shift creates faster liquidation and messier retracements.
What Does The VIX Spike Say About Risk Appetite?
VIX jumps 12.2% to 18.77 as demand for equity protection rises
The VIX at 18.77, up 12.2%, is the cleanest risk appetite signal on the board. It does not mean equities must keep falling in a straight line. It means the cost of protection is rising because traders are paying up for downside hedges.
That changes the character of the Nasdaq analysis. A calm-volatility pullback can invite fast dip buying. A falling index with a rising VIX tells me buyers are more cautious and sellers have more room to press. The market is asking for protection, and that demand usually does not appear when investors are comfortable holding crowded tech exposure.
Volatility expansion shifts the tape from dip-buying to risk control
When volatility expands, the priority changes. Traders who normally buy the first red candle may wait for confirmation. Portfolio managers may cut exposure before support actually breaks. Options desks may hedge dynamically as price moves, which can increase intraday swings.
That is why the current Nasdaq selloff needs to be read differently from a routine pullback. The VIX spike adds speed risk. Price can snap back sharply, then roll again. It can also break another leg lower before most traders get a clean entry. This is the environment where trade location matters more than directional opinion.
Higher hedging demand increases two-way risk for late Nasdaq shorts
The late short is not automatically wrong, but it is usually fragile. After downside expansion, sellers who enter near the lows are exposed to a retracement into the same imbalance they should have waited for. Rising VIX increases that two-way risk because intraday moves widen.
That is why I prefer a structured short setup over a reaction trade. Let price bounce. Let liquidity build above minor highs. Let the market show whether it can reclaim broken structure or whether sellers defend the retracement. A cleaner read beats a faster click.
Chip Stocks Lead The Growth Stock Weakness
Semiconductor pressure weighs on the Nasdaq Composite and mega-cap growth complex
Chip stocks are central to the Nasdaq’s weakness because semiconductors have been a leadership group for the growth trade. When that leadership group starts losing sponsorship, the index feels it quickly. The Nasdaq Composite is more sensitive to that pressure than the Dow, which explains part of the relative underperformance at 25,520.
Semiconductor weakness also carries a psychological charge. Traders have treated AI and chip demand as a core growth narrative. When those names start to wobble, the market questions whether leadership is broadening or simply breaking down.
Weak chip stocks can signal reduced appetite for high-beta tech exposure
High-beta tech depends on confidence. Buyers need to believe earnings growth, liquidity, and valuation support can all hold together. Rising oil, elevated yields, and a VIX spike make that harder.
Chip weakness can become a warning signal because it often sits near the center of risk appetite. When traders dump semiconductors, they usually become less willing to pay premium multiples for other long-duration growth shares as well. That does not mean every tech name is broken, but it does mean the burden of proof shifts back to buyers.
Watch whether selling broadens beyond AI and semiconductor leaders
The next read is breadth. Selling concentrated in AI and semiconductor leaders can still stabilize if capital rotates into software, communication services, or defensive mega-caps. A broader unwind is more dangerous because it shows institutions are raising cash rather than rotating inside equities.
I want to see whether the Nasdaq can hold relative structure while chip stocks remain weak. A minor bounce in the index that occurs while more components break down would be low quality. A bounce supported by improving breadth, declining VIX, and reclaimed intraday levels would deserve more respect.
How Does Oil-Led Macro Risk Pressure Tech?
WTI crude rises 4.5% to $82.47 as U.S.-Iran tension adds supply-risk premium
WTI crude is trading at $82.47, up 4.5%, and that matters for tech more than some equity traders want to admit. Oil strength tied to geopolitical supply risk adds an inflation premium. It can keep rates sticky, tighten financial conditions, and pressure the valuation framework for growth stocks.
For readers following the energy side of this move, the current oil setup connects directly with recent WTI crude oil supply-risk analysis. Energy is not just a separate commodity story here. It is part of the reason equity traders are reducing risk.
CNBC’s forward-looking market programming has also highlighted the importance of major macro catalysts around the session, which is useful context when oil, volatility, and equities are moving together. You can review that broader setup through CNBC’s Look Ahead segment.
The U.S. 10-year yield remains elevated at 4.551%, limiting a clean rates tailwind
The U.S. 10-year Treasury yield is sitting near 4.551%, down 0.4% on the session but still elevated enough to limit a clean relief bid for tech. Growth stocks prefer falling yields with confidence. What they have right now is falling equities, rising volatility, and oil-led inflation concern.
That mix is awkward. A modest dip in yields does not automatically rescue the Nasdaq when macro risk is rising elsewhere. Tech traders need lower yields, stable energy, and calmer volatility to rebuild a convincing risk-on backdrop.
Gold holding above $4,000 at $4,023 reinforces defensive rotation
Gold at $4,023, up 0.8%, reinforces the defensive tone. Investors are not only selling equities. They are also seeking protection in assets that tend to benefit when geopolitical stress and inflation risk rise.
Gold strength alongside a VIX spike and weaker equity indexes is a clear defensive rotation. The signal is simple enough: capital is moving toward protection and away from crowded growth exposure. That does not make every long setup invalid, but it raises the bar for buying dips.
Nasdaq Analysis: Market Structure And SMC Read
A 1.4% downside displacement signals control has shifted toward sellers intraday
From an SMC lens, the 1.4% Nasdaq drop is meaningful because it shows intraday control has shifted toward sellers. The key is not only the percentage move. The key is how price traveled. Fast movement lower often leaves imbalance, breaks minor structure, and creates areas where sellers may defend on retracement.
That is the market structure I care about now. The Nasdaq near 25,520 is a live reference point, not automatic support. Support only matters when price reacts and confirms it. Until then, it is just a number on a screen.
For traders building a deeper playbook around liquidity, displacement, and premium-discount logic, I’d pair this read with SMC trading strategies rather than relying on static support and resistance alone.
Avoid chasing late shorts after the impulse move lower
Late shorts are tempting because the chart looks obvious after the drop. That is exactly why I’m cautious. Obvious trades attract crowded entries, and crowded entries become fuel for sharp retracements.
A better Nasdaq analysis waits for the market to rebalance. Price may retrace into a fair value gap, revisit a broken intraday level, or raid a minor high before sellers step back in. Those areas give traders a defined invalidation point. Selling the low after a volatility burst usually gives you poor location and emotional risk.
Bearish retracement into imbalance or a clean liquidity sweep matters most
The cleanest bearish continuation would come from a retracement into an inefficient area left by the sell impulse, followed by rejection and renewed expansion lower. A stop-run above a minor intraday high that fails quickly would also be useful because it shows buyers were used for liquidity rather than genuine accumulation.
The bullish alternative is a reclaim with acceptance. Price would need to recover broken structure, hold above it, and show that sellers no longer control the auction. Without that, a bounce is only a bounce.
How Should Traders Approach A Risk Off Market?
Continuation setup: sell a failed retracement if price rejects premium or imbalance
My preferred continuation idea is patient. Let the Nasdaq retrace from the 25,520 area into a premium zone relative to the latest impulse, or into a visible imbalance left by the drop. Sellers want to see rejection there, not hesitation. A weak bounce into supply followed by renewed downside pressure is a cleaner setup than selling into stretched lows.
Risk should be defined above the rejection zone or the swept high, depending on the structure. The target should respect nearby liquidity rather than fantasy levels. In a fast tape, getting paid at logical liquidity pools is better than hoping for a perfect trend day.
Reversal risk: a liquidity sweep and reclaim can trigger short-covering before trend resumes
Short-covering risk is real while the VIX is rising. A liquidity sweep below a visible low followed by a strong reclaim can trap fresh shorts and force a squeeze. That does not necessarily flip the broader bias bullish, but it can create a violent countertrend move.
Traders should separate a scalp reversal from a trend reversal. A reclaim can produce upside back into imbalance or broken structure. A real shift needs acceptance, improving breadth, calmer volatility, and reduced pressure from chip stocks.
Risk management: size down while VIX is rising and macro headlines remain active
When the VIX is up 12.2% and oil is up 4.5%, position size matters more than conviction. Wider ranges punish oversized trades. Macro headlines around U.S.-Iran tension can hit without warning, and index liquidity can thin quickly during volatile bursts.
I would rather trade smaller and execute cleanly than size normally in a headline-driven tape. Stops need room, but not excuses. A trader who cannot define invalidation in this environment should not be pressing buttons.
The forward-looking question is whether sellers can defend the next Nasdaq retracement, or whether a sweep and reclaim near current structure forces a squeeze before the broader downtrend decision is made. That answer will matter more than any opinion formed after the first red impulse.
FAQ
What caused the Nasdaq selloff today?
The Nasdaq selloff is being driven by a risk-off rotation across growth stocks, led by chip weakness, a 12.2% VIX jump to 18.77 and WTI crude rising 4.5% to $82.47. Elevated 10-year yields near 4.551% are also limiting rate-sensitive tech demand.
Is the Nasdaq Composite at support near 25,520?
Not automatically. The Nasdaq Composite is trading near 25,520 after a 1.4% intraday drop, but that level should be treated as a live reference point, not confirmed support. Traders need evidence such as a liquidity sweep, rejection, or reclaimed imbalance before calling a tradable reaction.
How does the VIX spike affect Nasdaq analysis?
A VIX spike changes Nasdaq analysis because it signals rising demand for equity protection and less tolerance for crowded tech exposure. When volatility expands while indexes fall, late shorts can still be vulnerable to sharp retracements, so entries need cleaner market structure confirmation.
Why does rising oil matter for chip stocks and growth shares?
Rising oil matters because it adds an inflation and supply-risk premium that can keep yields elevated and pressure long-duration equities. With WTI at $82.47 on U.S.-Iran tension, investors may reduce chip stocks and high-multiple growth names in favor of defensive assets like gold.
What is the SMC trading plan after a 1.4% Nasdaq drop?
The SMC plan is to avoid chasing late shorts after the displacement lower. Watch for a bearish retracement into imbalance, premium pricing, or a clean liquidity sweep before looking for continuation. If price reclaims key structure with acceptance, reassess bearish bias.
Disclaimer: This article is for educational market analysis only and is not financial advice or a recommendation to buy or sell any asset.