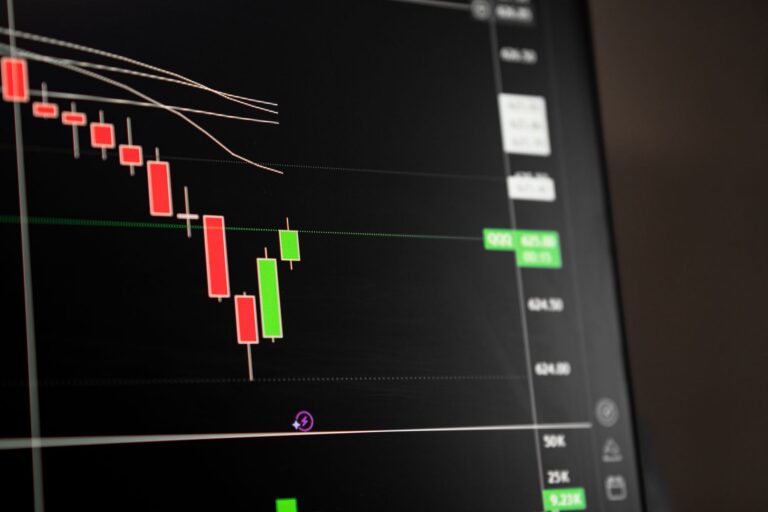
Nasdaq is trading near 26,290, down 1.3% intraday, while the S&P 500 is lower by 0.7% at 7,692 and the Dow is barely off by 0.2% at 53,343. That spread matters. A Nasdaq liquidity sweep setup is now in play because the damage is concentrated where growth risk lives, not across the whole tape. Yields are lower, DXY is weaker, and VIX is contained, yet tech is still leading the move down.
That combination tells me to read the decline through a Smart Money Concepts lens before calling it a clean macro dump. Price is moving toward downside liquidity, but the broader market is not acting like it has lost control. For traders using SMC trading strategies, the question is simple: does Nasdaq raid the 26,000 area and reject, or does it accept below demand and confirm a deeper bearish shift?
Why Is Nasdaq Leading the Tech Stock Selloff?
Nasdaq trades near 26,290, down 1.3% intraday, making it the strongest allowed mover lower today.
The Nasdaq Composite is the clear weak link on the board, with price sitting around 26,290 after a 1.3% intraday decline. That is a meaningful move for an index, especially when the other major benchmarks are holding up better. I care less about the red number by itself and more about the relative weakness. When Nasdaq sells harder than the S&P and Dow while volatility stays calm, it usually points to positioning stress in a specific pocket of the market.
That pocket is technology. Growth-heavy indexes are more sensitive to positioning, momentum unwinds, and institutional inventory shifts. When prior upside attempts fail to hold, the first real flush often targets obvious short-term lows rather than starting as a broad liquidation event.
Semiconductor weakness is the main headline driver, pulling growth and technology shares lower despite a softer macro backdrop.
Semiconductors are the pressure point. Chip weakness is dragging the complex lower, and that matters because semis often act like the risk barometer inside Nasdaq. When chips cannot absorb selling, large-cap tech and growth factors tend to follow.
External market commentary has also flagged chip pressure as a major driver, with one market recap noting that chips were slammed while the dollar wobbled. I treat that kind of headline as context, not a trade signal. The chart still has to prove whether sellers are creating continuation or simply forcing a stop-run into resting liquidity.
S&P 500 is down 0.7% at 7,692 while the Dow is down only 0.2% at 53,343, confirming pressure is concentrated in tech.
The S&P 500 at 7,692 is down 0.7%, while the Dow at 53,343 is down only 0.2%. That confirms the selloff is not evenly distributed. Industrials and older-economy exposure are absorbing the session better than tech, which keeps the focus on Nasdaq-specific flows.
For a broader equity read, I still want to compare Nasdaq against other benchmarks and macro assets. That is where more market analysis becomes useful. A Nasdaq decline means something different when the Dow is flat, VIX is falling, yields are lower, and the dollar is soft.
Nasdaq SMC Analysis: What the Selloff Reveals
The move lower suggests buy-side exhaustion after prior upside attempts failed to sustain above intraday supply.
The first read in my Nasdaq SMC analysis is buy-side exhaustion. Price tried to hold higher levels but could not sustain above intraday supply. Once buyers stop getting follow-through, the market often rotates lower to rebalance inefficient delivery and test where real demand sits.
In SMC terms, failed continuation above supply often leaves late buyers trapped. The market does not need panic to move lower from there. It only needs a lack of fresh demand and enough resting sell-side liquidity below to justify the move.
Equity index liquidity is likely being drawn toward resting sell-side levels below current price rather than reacting to a broad panic impulse.
Equity index liquidity tends to collect around obvious lows, round numbers, and prior reaction points. With Nasdaq trading near 26,290, the 26,000 handle stands out. It is close enough to matter intraday, visible enough to attract stops, and psychologically clean enough for traders to over-anchor around it.
That does not mean 26,000 must hold. It means the area is likely to matter. A stop-run through or into that zone can create the conditions for a tradable reversal only after price shows rejection, displacement, and a credible market structure shift.
VIX remains contained at 15.48, down 2.3%, supporting a liquidity-driven retracement framework over a full risk-off breakdown.
VIX at 15.48, down 2.3%, is the part of the snapshot that keeps me from treating this as a disorderly risk-off event. A full equity breakdown usually comes with rising volatility, wider stress signals, and more synchronized selling across indexes.
Here, Nasdaq is taking the hit while VIX is subdued. That supports a cleaner liquidity framework. Sellers are pressing into known levels, but the market is not screaming systemic fear. My opinion: this is exactly the kind of session where traders get chopped up if they short late into the pool instead of waiting for the reaction after the raid.
Key read: Nasdaq weakness is real, but the macro tape is mixed rather than outright hostile. That makes the 26,000 liquidity area more important than the headline percentage decline.
Where Is the Next Nasdaq Liquidity Sweep Zone?
Nearby downside liquidity sits around the 26,000 area, which has not yet been fully reached from the current 26,290 region.
The next obvious Nasdaq liquidity sweep zone sits around 26,000. From the current 26,290 region, price has room to press lower before testing that handle. The distance is not extreme for an intraday index move, but it is large enough that chasing shorts after a 1.3% drop carries poor location risk.
I have watched this pattern for years across forex, crypto, and equity indexes: the best-looking short often appears right before price tags the sell-side pool and reverses into late sellers. That observation is not a prediction. It is a reminder to separate clean bearish structure from poor execution location.
A deeper demand reaction zone to monitor sits near 25,900-26,050 if sellers continue pressing into resting liquidity.
The broader demand reaction band sits near 25,900 to 26,050. That zone captures the round-number liquidity at 26,000 and gives room for a shallow undercut. In real trading, price rarely respects a single clean line. It probes, wicks, fills, and then either rejects or accepts.
That is why I prefer zones over exact levels. A sharp move into 25,900 to 26,050 followed by aggressive buying would tell me sellers may have completed the raid. Slow bleeding through the zone with no expansion back upward would say something very different.
Traders should wait for evidence of displacement, rejection, or a market structure shift before treating any liquidity run as actionable.
A sweep alone is not a long signal. A wick below a level is not enough. Traders need evidence that the market has changed behavior after taking liquidity. That evidence can come through a strong rejection candle, a displacement leg back above a minor swing, or a proper market structure shift on a lower timeframe.
For traders still building their framework, the difference between liquidity, imbalance, and an order block in trading matters. A reaction from demand becomes more meaningful when it aligns with a prior institutional candle, a clean imbalance, and a break back through short-term supply.
Is This a Rates-Driven Equity Dump?
US 10Y yield is lower at 4.655%, down 1.1%, so the Nasdaq decline is not a simple rates-up equity selloff.
The US 10Y Treasury yield is lower at 4.655%, down 1.1%. That matters because the classic Nasdaq pressure script usually reads like this: yields rise, duration-sensitive growth stocks reprice, Nasdaq falls. That script does not fit cleanly here.
Lower yields should, in theory, reduce pressure on long-duration tech valuations. Yet Nasdaq is still selling. That tells me positioning and sector leadership are carrying more weight than the rates impulse during this session.
DXY is down 0.6% at 99.11, meaning the index is falling even with a weaker dollar backdrop.
DXY is also lower, down 0.6% at 99.11. A weaker dollar often helps risk appetite at the margin, especially when paired with lower yields. EUR/USD at 1.1639 and GBP/USD at 1.3599 are both firmer, while USD/JPY is lower at 158.54.
That backdrop makes the Nasdaq decline more interesting. The index is not falling because the dollar is ripping higher and financial conditions are suddenly tightening intraday. It is falling while some traditional risk inputs are softer.
This divergence increases the importance of sector-specific weakness, especially chips, in the intraday SMC read.
Sector weakness deserves the spotlight. Semiconductors can drag Nasdaq lower even when the macro backdrop is not aggressively bearish. That is why I do not want to force a broad-market explanation onto a sector-led move.
Market outlets have also focused on equity benchmarks testing highs and reacting to inflation and macro expectations, including Investing.com analysis on S&P 500 record-high dynamics. That broader context helps, but the immediate tape says tech is carrying the downside burden.
Market Structure Shift Levels Bulls Must Reclaim
For bullish continuation, Nasdaq needs to reclaim the broken intraday supply zone around 26,500-26,700.
The key upside zone is 26,500 to 26,700. That area now functions as broken intraday supply. Bulls need to recapture it with authority before I would treat the current decline as a completed reset.
A weak bounce toward that band does not prove much. Price can rally into supply, fill part of an imbalance, and still rotate lower. The quality of the move matters. Expansion, candle closes, and acceptance tell the story.
A bounce into 26,500-26,700 without acceptance may act as a lower-timeframe redistribution area.
A rally into 26,500 to 26,700 that stalls could become redistribution. That would mean shorts covered, dip buyers stepped in, and larger sellers used the bounce to reload. The market would then be vulnerable to another push toward 26,000 or the deeper 25,900 to 26,050 band.
This is where lower-timeframe structure earns its keep. A bounce that cannot break minor highs is only a correction. A bounce that breaks structure, holds the retest, and expands through supply has a different character.
A clean reclaim with displacement could turn the selloff into a buy-side exhaustion reset rather than a deeper bearish reversal.
A decisive move back above 26,500 to 26,700 would improve the bullish case. The best version for bulls would be a sweep or near-sweep into downside liquidity, followed by strong displacement back through intraday supply and acceptance above the reclaimed area.
That sequence would frame the drop as a reset after buy-side exhaustion rather than the start of a deeper bearish reversal. Reuters-linked market updates have recently noted major indexes closing lower as investors watched key data and earnings themes, which reinforces the need to separate normal index rotation from true breakdown conditions through cross-market confirmation.
Fair Value Gap and Demand Reaction Plan
Map any fair value gap created during the tech-led displacement to identify where price may rebalance before the next impulse.
A fair value gap created during the selloff becomes important on any bounce. When price delivers one-sided movement, it often leaves inefficient areas behind. Those gaps can act as magnets during a retracement, especially when they sit below the broken 26,500 to 26,700 supply zone.
I would map the sell-side expansion leg and mark the cleanest imbalance. Then I would watch how price behaves when it trades back into that area. Fast rejection from a gap below supply favors continued bearish control. Clean acceptance through the gap suggests the selling pressure is losing grip.
If price sweeps toward 26,000, watch whether buyers defend the 25,900-26,050 demand band with strong candle closes.
If price sweeps toward 26,000, the reaction inside 25,900 to 26,050 becomes the main event. Strong candle closes back above the swept level would show buyers absorbing supply. A lazy bounce with overlapping candles would be less convincing.
Volume behavior, wick structure, and displacement away from the zone all matter. I do not need perfection. I need evidence that the stop-run has shifted control from sellers to buyers.
Invalidation risk rises if Nasdaq accepts below the deeper demand zone without a bullish market structure shift.
Acceptance below 25,900 would weaken the bounce thesis. At that point, the market would no longer be simply raiding nearby equity index liquidity. It would be accepting below a demand band that bulls should have defended.
That opens the door to a deeper retracement and forces traders to reassess bias. The cleanest bearish continuation would be a failed reclaim of 25,900 to 26,050 after price breaks below it. The cleanest bullish response would be a fast reclaim, structure shift, and push back toward 26,500 to 26,700.
- Immediate liquidity: 26,000 remains the nearby downside magnet.
- Demand band: 25,900 to 26,050 is the reaction zone I care about most.
- Bullish reclaim: 26,500 to 26,700 must be recaptured for stronger upside continuation.
- Macro filter: Lower 10Y yield, weaker DXY, and contained VIX argue against calling this broad panic.
FAQ
What is the Nasdaq liquidity sweep setup today?
The Nasdaq liquidity sweep setup focuses on whether the tech-led decline draws price toward sell-side liquidity near 26,000. With Nasdaq trading around 26,290 and down 1.3%, traders are watching for a controlled sweep, reaction, and possible market structure shift rather than assuming support has already held.
Why is Nasdaq falling if yields and the dollar are lower?
Nasdaq weakness is being driven more by sector pressure than by a classic macro selloff. US 10Y yields are lower at 4.655% and DXY is down 0.6%, but semiconductor weakness is dragging technology stocks lower, creating concentrated pressure in growth-heavy equity indexes.
Which levels matter most for Nasdaq SMC analysis?
The key downside liquidity area is around 26,000, with a broader demand reaction zone near 25,900 to 26,050. On the upside, bulls need to reclaim 26,500 to 26,700. Until that supply zone is regained, a bounce may remain corrective within bearish intraday structure.
Does the VIX confirm panic selling in tech stocks?
No. VIX is still contained near 15.48 and is down 2.3%, which argues against broad panic. That supports an SMC framework where the decline may be targeting equity index liquidity and rebalancing imbalances rather than signaling a disorderly market-wide risk event.
What would confirm bullish continuation after the selloff?
Bullish continuation requires more than a small bounce. Nasdaq should sweep or approach liquidity, show rejection or displacement, form a market structure shift, and then reclaim the 26,500 to 26,700 supply area. Acceptance above that zone would improve the case for renewed upside.
The next few sessions should clarify whether 26,000 becomes a stop-run and reversal area or the doorway into a broader tech-led retracement. I am watching the reaction, not guessing the low. What do you see first: a clean reclaim of 26,500 to 26,700, or acceptance below demand?
Disclaimer: This article is for educational analysis only and is not financial advice or a recommendation to buy or sell any instrument.