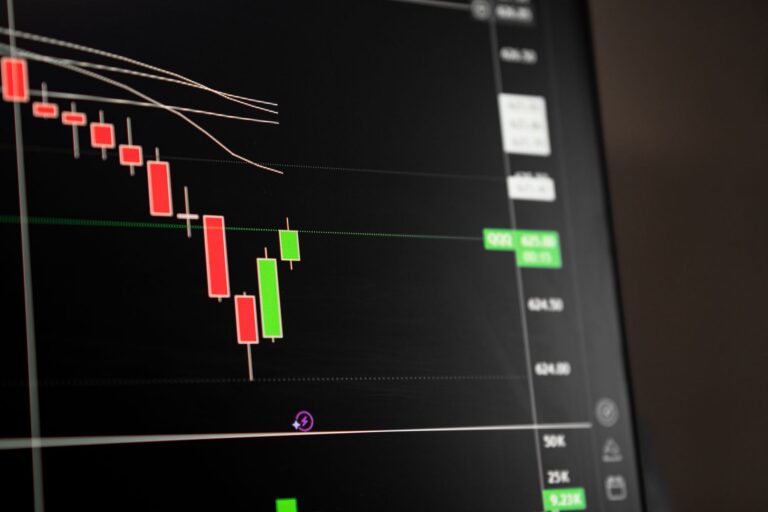
You mark a clean zone, price taps it, hesitates, then slices through your stop. That is the problem behind the question, what is an order block in trading, because the answer is not a prettier rectangle. The value is knowing which candle actually mattered and when the idea is dead.
An order block in trading is a price zone, usually the final opposing candle or small consolidation before an aggressive expansion that breaks structure. Smart Money Concepts traders use it to locate probable institutional buying or selling, with invalidation beyond the zone and confirmation from liquidity and imbalance.
For scale only, market snapshots can show why precision matters. A TS2 market update dated Aug. 13, 2026 listed the S&P 500 at 7,745 and the Nasdaq Composite at 26,645, two large index levels where a sloppy 1 percent zone would mean a huge difference in risk sizing, according to TS2’s Aug. 13 market update. A separate TS2 update dated Aug. 12, 2026 is one calendar day earlier, a useful reminder that one session’s headline should not be confused with a structural trading level, according to TS2’s Aug. 12 market update.
I’ve watched traders get better at order block trading only after they stop drawing every big candle and start asking a harder question: did this zone cause something meaningful? My clear opinion is that most order block charts online are overmarked. Fewer zones, stricter validation, better decisions.
What Is an Order Block in Trading?
A simple SMC definition: the final opposing candle or small consolidation before a strong displacement move
In Smart Money Concepts, an order block is usually marked from the final candle that moves against the eventual direction before price launches away. For a bullish setup, that often means the last bearish candle before a sharp rally. For a bearish setup, it is commonly the last bullish candle before a sharp decline.
The word “usually” matters. Sometimes the true origin is a tight cluster of candles rather than one perfect candle. Markets do not always print textbook examples. A clean zone might be a single candle on the four-hour chart, while the fifteen-minute view reveals a compact base, a sweep, a pause, and then the real expansion.
The key is causality. The zone should be connected to the move that changed the chart. A random candle in the middle of chop is not enough. A zone that launches price through prior highs or lows, creates imbalance, and leaves traders chasing is far more interesting.
Why traders view these zones as the origin of smart money buying or selling
SMC traders use the idea because large players cannot always enter or exit at one clean price. Their activity often shows up as accumulation, distribution, absorption, and then a forceful move away. The order block is treated as the footprint of that activity.
That does not mean a trader can prove a bank bought at one exact candle. Retail traders do not have access to the full institutional order book in spot forex, crypto, or most CFD environments. The practical claim is more modest: the candle marks the likely origin of the move that mattered.
When price later returns to that origin, traders expect remaining interest, hedging activity, or algorithmic rebalancing to create a reaction. Sometimes it does. Sometimes price runs straight through. That is why invalidation is part of the concept, not an afterthought.
How the concept fits inside broader Smart Money Concepts analysis
An order block by itself is incomplete. It works best as one component inside a full market model: structure, liquidity, imbalance, premium and discount, session timing, and risk placement. For a deeper map of the framework, read this Smart Money Concepts guide.
Good SMC analysis starts with the higher-timeframe story. Is the market making higher highs and higher lows, or lower highs and lower lows? Has price swept a major level? Is the current zone in discount for longs or premium for shorts? The block is the execution area, not the whole thesis.
That distinction saves traders from forcing setups. A bearish zone in the middle of a strong bullish daily expansion may still react, but it is fighting the broader order flow. A bullish zone sitting below a swept low, inside higher-timeframe discount, with a sharp recapture of structure has a much better narrative.
How Do Bullish and Bearish Order Blocks Work?
Bullish blocks start with the last bearish candle before an impulsive rally
A bullish order block is commonly drawn from the high to the low of the final bearish candle before a strong move upward. Some traders use the full candle, wick to wick. Others use the body only. A refined approach looks inside the candle on a lower timeframe to find the most precise demand area.
The bullish version should do more than create a green candle afterward. It should push price away with conviction. Ideally, the rally breaks a prior swing high, closes with wide-bodied candles, and leaves little overlap. That shows initiative buying rather than a weak bounce.
Imagine price trades below a prior low, triggers stops, quickly reclaims the level, then rallies hard through a local swing high. The last bearish candle before that rally becomes a candidate bullish zone. The stop-run provides liquidity context. The structure break provides confirmation. The return to the zone provides a possible entry.
Bearish blocks form from the last bullish candle before an impulsive selloff
A bearish order block is the mirror image. Traders mark the final bullish candle before price drops aggressively. The best examples often appear after price raids a prior high, fails to hold above it, and then sells through a meaningful swing low.
The logic is simple. Buyers were encouraged above the old high, breakout traders entered, short stops were filled, and then price reversed hard. That reversal leaves trapped longs and possibly institutional selling near the origin. When price revisits the area, sellers may defend it again.
Bearish zones can be powerful, but they are also abused. A red candle after a green candle does not create a valid setup. The selloff needs expansion. The move should alter structure or create a clear imbalance. Without that, the zone is just a local reaction area.
Mitigation explains why price often returns before continuing
Mitigation is the idea that price comes back to a prior origin zone before continuing the broader move. In plain English, the market returns to clean up business left behind. That may involve unfilled orders, hedges, rebalancing, or simply the mechanical tendency of price to revisit inefficient areas.
A typical bullish sequence looks like this: price sweeps liquidity below a low, expands upward, breaks structure, leaves an inefficient pocket, and later pulls back into the bullish zone. Traders then watch for reaction, lower-timeframe confirmation, or a limit entry depending on their plan.
There is a failure side too. A mitigated zone can become weak after price trades deep into it multiple times. The first return is often cleaner than the third or fourth. Once the market has already revisited and balanced the area, expecting the same reaction again is usually poor trade selection.
How Do You Identify Order Blocks Step by Step?
First, read the market structure shift, break of structure, or change of character
The first job is to find the moment where the chart changed behavior. In SMC language, traders often call this a break of structure or a change of character. The label matters less than the event. Price must take out a meaningful swing and show that control has shifted.
For a bullish idea, look for price to break above a prior lower high or important swing high after downside pressure. For a bearish idea, look for price to break below a prior higher low or important swing low after upside pressure.
A small wick through a minor level is not enough for me. I want to see a real close, a decisive push, or a follow-through candle that tells me the move had sponsorship. Thin structure breaks inside messy ranges produce weak zones.
Next, locate the expansion leg and mark the final opposing candle before the move
After the shift is visible, trace the expansion leg back to its origin. The final opposing candle before that move is your first candidate. In a bullish move, mark the final down candle before price drove higher. In a bearish move, mark the final up candle before the selloff began.
This is where many traders overcomplicate the chart. They mark five zones in the same leg, then wonder which one to trade. Start with the candle closest to the displacement that actually caused the structural break. The origin of the break is usually more important than a random candle far behind it.
When learning how to identify order blocks, I recommend marking zones only after the break is confirmed. Anticipating every possible block before structure changes creates bias. Let the market reveal the important leg first, then work backward.
Refining the zone with the candle body, wick, or lower-timeframe structure
There are three common ways to draw the zone. The broadest method uses the full candle range. A tighter method uses the candle body. The most precise method drops to a lower timeframe and marks the actual mini-structure inside the candle.
Full-range zones give price more room to react, but they increase stop distance. Body-only zones improve reward-to-risk on paper, but they can miss valid wick reactions. Lower-timeframe refinement is often the best compromise, especially in crypto and forex where wicks can be violent.
For example, a four-hour bullish candle setup might contain a fifteen-minute liquidity grab, a small base, and a sharp rally. Instead of blindly using the entire four-hour candle, a trader can refine to the smaller base that caused the launch. That reduces risk, but it also demands cleaner execution.
What Makes an Order Block Valid in SMC?
Displacement should show a strong, one-sided move away from the zone
Displacement is the first quality filter. Price should leave the zone with urgency. Wide bodies, consecutive candles in one direction, small pullbacks, and fast distance from the origin all suggest stronger initiative.
Weak departures are suspect. A zone that produces overlapping candles and no structural break is usually noise. The market may react there again, but it does not deserve the same respect as a block that launched a clean directional leg.
Strong expansion also helps define timing. A market that leaves quickly often returns later to rebalance. That return can create the trade. A market that grinds away slowly may have already consumed liquidity along the path, reducing the value of the original area.
Structure and imbalance improve the quality of the setup
Higher-quality zones tend to break structure and leave an imbalance. A fair value gap is one common form of imbalance, where price moves so quickly that the candles leave an inefficient area with limited overlap. You can study that concept in this fair value gap guide.
The structure break tells you the move mattered. The imbalance tells you price traveled inefficiently. Together, they make the origin more meaningful. A block that creates neither is usually just a candle with a label.
One practical filter: ask whether the zone caused other traders to change their decisions. Did shorts cover? Did breakout traders enter? Did stops get triggered? Did price move far enough to create fresh pressure? The better zones usually answer yes to more than one of those questions.
Liquidity context often separates the best smart money order block from the rest
The best smart money order block often forms after liquidity has been taken. That might be a raid below equal lows before a bullish reversal, or a push above equal highs before a bearish reversal. Liquidity gives the move a reason to exist.
Markets need counterparties. A sweep below obvious lows can provide sell-side liquidity before a rally. A run above visible highs can provide buy-side liquidity before a decline. For a focused breakdown, read this guide to liquidity sweeps.
A clean example is a range where price dips under the low, immediately reclaims it, then expands above the midpoint and breaks the range high. The bullish zone near the sweep is more attractive than a random demand candle in the middle of the range because the stop-run created context.
Failure appears when the sweep keeps going. A low gets taken, traders call it a liquidity grab, but price does not reclaim structure. It continues lower. That is not a bullish setup. That is downside continuation, and the supposed block becomes a trap.
How Should Traders Enter and Manage Risk?
Entry logic can use a limit order or lower-timeframe confirmation
There are two main entry styles. The aggressive trader places a limit order inside the zone and accepts that the trade may trigger without confirmation. The conservative trader waits for price to tap the area, then looks for a lower-timeframe shift before entering.
Limit entries offer better pricing when they work. They also get filled in zones that fail immediately. Confirmation entries reduce some false starts, but they often enter later and may worsen the reward profile. Neither method is superior in every market.
My preference is context-dependent. In a clean higher-timeframe zone with a fresh liquidity sweep and strong expansion, I am more willing to use a planned limit. In choppy conditions, I want the lower timeframe to prove buyers or sellers have stepped in.
Invalidation belongs beyond the block, not inside it
Risk management is where order block smc either becomes useful or turns into decoration. A bullish zone is generally invalidated below its low. A bearish zone is generally invalidated above its high. Some traders add a buffer for spread, volatility, or the character of the asset.
Putting the stop inside the zone is usually a mistake. Price can trade into the area, fill inefficient pricing, wick through the body, and still respect the full range. A stop inside the block often exits before the real invalidation occurs.
That does not mean the stop should be huge. It means the zone must be chosen carefully enough that a logical stop still produces acceptable risk. When the invalidation point is too far away, the answer is often to refine the zone or skip the trade.
Timeframes decide weight, precision, and noise
Higher-timeframe blocks carry more weight because they reflect broader participation. A weekly or daily zone can influence price for longer than a five-minute setup. That said, higher-timeframe areas can be wide, which makes entries difficult without refinement.
Lower timeframes help sharpen execution. A trader might use the daily chart for direction, the four-hour chart for the main zone, and the fifteen-minute chart for entry confirmation. That hierarchy keeps the big picture in control while allowing practical risk placement.
Crypto traders should be especially careful here. Bitcoin and Ethereum can respect technical zones beautifully, then violate them during news-driven volatility or thin liquidity periods. For broader context on planning around crypto volatility, see this guide on how to trade Bitcoin.
Order Block vs Support and Resistance: What Is the Difference?
Support and resistance are broad reaction areas; order blocks are tied to displacement and structure
The order block vs support resistance debate matters because both can look like rectangles on a chart. Traditional support and resistance comes from repeated reactions at a level. Price bounced there before, so traders watch it again.
An SMC zone is more specific. It is tied to the origin of a structural move. The question is not merely, “Did price react here before?” The better question is, “Did this area cause a meaningful shift, leave imbalance, and change the behavior of participants?”
Support and resistance can be useful. I still pay attention to obvious weekly highs, daily lows, range extremes, and prior consolidation shelves. But I do not treat every historical reaction as a smart money zone. That shortcut creates clutter.
An SMC block connects liquidity, imbalance, and the origin of an institutional-style move
A strong SMC setup usually has a story. Price takes liquidity, rejects, expands, breaks structure, and leaves an inefficient pocket. The block sits near the start of that chain. That is why traders give it special attention.
Traditional support might say, “Price bounced at 100 three times.” The SMC view asks what happened before and after the bounce. Was there a sweep? Did the move break structure? Did price leave an imbalance? Was the return into premium or discount?
This extra filtering does not make the setup certain. It makes the reasoning more precise. Precision matters because it affects where you enter, where you admit you are wrong, and whether the trade is worth taking at all.
Why the difference changes entries, invalidation, and trade selection
Support and resistance traders often place stops beyond the broader level. Order block traders usually place invalidation beyond the exact candle or refined structure that caused the move. That can make risk cleaner, but only when the zone is valid.
Trade selection also changes. A support zone in the middle of a range may be tradable for a quick scalp. A bullish SMC zone after a sell-side raid and structural reversal may support a more complete directional idea. Those are different trades.
The failure case is assuming SMC language makes a weak level strong. Calling a support area an order block does not upgrade it. Without expansion, structure, and liquidity context, the label adds nothing.
Common Order Block Trading Mistakes to Avoid
Labeling every candle instead of filtering for expansion and structure
The most common mistake is chart pollution. Traders mark every last up candle before a drop and every last down candle before a rally. Soon the chart is covered in boxes, and every move looks like a setup.
Filter harder. The zone should cause a meaningful move. It should break structure or contribute to a clear change in character. It should leave price with energy. A candle that sits inside a slow grind is usually not worth marking.
A cleaner chart improves decision quality. You see the important levels faster. You stop reacting to every small tap. You become more selective, which is where serious trading begins.
Trading fully mitigated zones or ignoring higher-timeframe context
Fresh zones deserve more attention than heavily revisited ones. Once price has returned to a block and balanced it, the original inefficiency may be reduced. Repeated taps often weaken the level, especially when each reaction becomes smaller.
Higher-timeframe context also matters. A five-minute bullish zone inside a daily bearish leg can work, but expectations should be modest. The larger flow may use that bounce as liquidity for continuation lower.
Before entering, locate the zone within the broader range. Longs are generally more attractive in discount or after sell-side liquidity has been taken. Shorts are generally more attractive in premium or after buy-side liquidity has been raided. Context filters bad ideas before they cost money.
Entering without confirmation and placing stops inside the block
Many failed trades come from impatience. Price approaches a zone, the trader enters early, then the market drives deeper into the block before reacting. The thesis may have been reasonable, but the execution was poor.
Confirmation can be simple. On a lower timeframe, watch for a micro structure shift, a failed continuation move, a strong reclaim, or a displacement candle away from the zone. The goal is to see evidence that the area is being defended.
The stop belongs beyond invalidation. For bullish ideas, that usually means below the zone low. For bearish ideas, it usually means above the zone high. When that stop is too large for the account or the setup, reduce size, refine the entry, or leave it alone.
Failure is part of the model. A bullish zone fails when price accepts below it and continues lower. A bearish zone fails when price accepts above it and continues higher. Do not “give it room” after invalidation. That phrase has damaged more accounts than bad analysis ever did.
Traders who want more practical applications can browse additional SMC trading strategies, but the core remains the same: mark fewer levels, demand stronger evidence, and define the point where the idea is wrong before the order is live.
FAQ
What is an order block in trading?
An order block in trading is a price zone, usually the last opposing candle or tight consolidation before a strong displacement move. In SMC, traders treat it as the likely origin of smart money buying or selling, especially when it breaks structure and leaves imbalance.
How do I identify a valid order block?
Start by finding a break of structure or change of character. Then locate the displacement leg that caused it and mark the final opposing candle before the move. A stronger zone usually creates imbalance, follows a liquidity sweep, and remains relatively fresh.
What is the difference between a bullish and bearish order block?
A bullish order block is commonly the last bearish candle before an impulsive rally and may act as a demand zone on return. A bearish order block is the last bullish candle before an impulsive selloff and may act as a supply zone on return.
Where should a stop loss go when trading an order block?
Stops are typically placed beyond the invalidation point, not inside the zone. For a bullish setup, invalidation is usually below the block low. For a bearish setup, invalidation is usually above the block high, depending on the market, spread, and timeframe.
Is an order block the same as support and resistance?
No. Support and resistance are broad historical reaction zones. An order block is more specific because it is tied to displacement, liquidity, imbalance, and market structure. SMC traders use those extra conditions to judge whether a zone is likely meaningful or weak.
The next time price returns to a clean block, do not ask whether the rectangle looks perfect. Ask what it caused, what liquidity came before it, where it fails, and whether the risk still makes sense. What filter has helped you avoid the most false zones?
Trading involves risk, and this guide is for educational purposes only. It is not financial advice or a recommendation to buy or sell any market.