Nasdaq is sitting at 25,819, down 1.2%, and the tape has a clear message: growth risk is being marked down while rates and volatility push higher. This Nasdaq Composite analysis starts with that pressure point, because price is now close enough to the 25,800 liquidity area that the next reaction should matter more than the last red candle. I’m watching whether sellers can keep control below that zone, or whether the move turns into a stop-run and reclaim.
Nasdaq Composite Analysis: Tech Leads The Selloff
Nasdaq Composite trades near 25,819, down 1.2%, making it the weakest major U.S. index in today’s rotation.
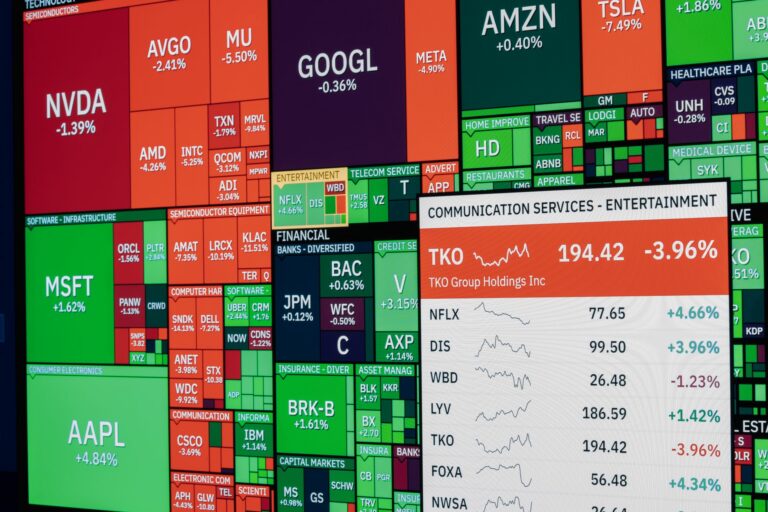
The Nasdaq Composite is the laggard on the board, trading near 25,819 after a 1.2% drop. That matters because weakness is not evenly distributed. The market is selling the higher-duration, higher-beta part of the equity complex first, which is usually where traders see the cleanest signal during a risk-off trading session.
I don’t treat every Nasdaq dip as a buyable discount. When the index leads downside while volatility expands and yields rise, the first job is to respect the sell program. Current U.S. equity pricing can be cross-checked against broad market data from MarketWatch U.S. market data, but the trading issue is more specific: Nasdaq liquidity is being tested near a short-term decision zone.
S&P 500 is down 0.4% at 7,504 while Dow slips 0.2% to 52,925, confirming pressure is concentrated in higher-beta growth exposure.
The spread between the indices is the tell. The S&P 500 is lower by 0.4% at 7,504, while the Dow Jones Industrial Average is down only 0.2% at 52,925. That relative strength in the Dow says this is not a broad liquidation across all U.S. equities. It is a rotation away from tech-heavy exposure.
For serious traders, that relative weakness matters more than the headline percentage move. A Nasdaq-led decline often creates sharper intraday imbalances, thinner bounces, and more reactive selling into premium. For readers tracking broader setups, I’d pair this with more market analysis rather than isolating the Nasdaq chart in a vacuum.
The decline reflects a risk-off trading session where long-duration tech is being repriced against tighter liquidity conditions.
Long-duration tech stocks are sensitive to the cost of money. When yields rise, the market discounts future earnings more aggressively. That pressure shows up first in the Nasdaq because the index carries a heavier growth bias than the Dow.
My opinion is straightforward: dip-buying the Nasdaq before liquidity confirms is low-quality trading. A selloff into a known liquidity pocket can produce a bounce, but the better edge comes after the stop-run, reclaim, and acceptance. Guessing the low because price “looks stretched” is how traders donate money to better-positioned participants.
Why Are Treasury Yields Pressuring Nasdaq Liquidity?
The U.S. 10Y Treasury yield is up to 4.567%, increasing the discount-rate headwind for growth and mega-cap technology names.
The U.S. 10Y Treasury yield is up to 4.567%, and that is a real headwind for growth equities. Higher treasury yields raise the hurdle rate for risk assets. Mega-cap technology can still hold up when earnings are dominant, but when yields and volatility rise together, buyers usually demand better prices.
That pressure is visible in the way Nasdaq is trading near 25,819 while the Dow is barely lower. This is classic duration repricing. The market is not saying every company is broken. It is saying future cash flows are being valued against a tighter rate backdrop.
Higher treasury yields can reduce demand for duration-sensitive equities and weaken Nasdaq liquidity during intraday rotations.
Nasdaq liquidity often looks fine when price is rising. The real test comes when yields pull capital toward cash and bonds, spreads widen, and intraday bids disappear faster than traders expect. That is when a 25,800 area becomes more than a round number. It becomes a liquidity marker.
From a Smart Money Concepts strategy perspective, I’m less interested in predicting every tick and more interested in how price behaves around obvious pools. A fast move below 25,800 that immediately recaptures the level is very different from a slow acceptance under it. One traps sellers. The other validates them.
A firmer DXY at 101.22 adds a second tightening impulse as dollar strength pressures risk assets and global liquidity appetite.
The U.S. Dollar Index is firmer at 101.22, up 0.2%. That adds another tightening impulse. A stronger dollar can weigh on global liquidity appetite because it makes dollar funding more expensive and tends to pressure risk assets outside the U.S. equity complex as well.
Bitcoin at 61,932, down 2.3%, and Ethereum at 1,738, down 2.4%, confirm that the pressure is not limited to Nasdaq. Gold is also lower at 4,093.10, down 1.6%, despite the risk-off tone. That mix tells me traders are raising cash rather than simply rotating into classic hedges. Broader cross-asset pricing is also available through CNN Markets.
What Does The VIX Spike Say About Risk Off Trading?
The VIX is up 9.1% to 17.59, showing protection demand is expanding instead of traders aggressively buying the dip.
The VIX is up 9.1% to 17.59. That is not panic, but it is a clear expansion in protection demand. When volatility lifts while Nasdaq sells off, I assume sellers have more control until proven otherwise.
There is a big difference between a dip that occurs with calm volatility and a dip that occurs while hedging demand rises. The first can grind higher as buyers step in. The second often produces violent two-way trade, failed rallies, and lower-high structures.
VIX expansion during Nasdaq weakness supports a risk-off trading read, especially when tech underperforms the Dow and S&P 500.
The combination matters: Nasdaq down 1.2%, S&P 500 down 0.4%, Dow down 0.2%, and VIX up 9.1%. That is a clean risk-off trading read. Tech is the pressure point, volatility is confirming caution, and yields are refusing to help the bulls.
WTI crude at 73.37, up 4.2%, adds another wrinkle. Energy strength can keep inflation concerns alive, which can make bond traders less willing to price in easier financial conditions. That does not automatically mean Nasdaq must collapse, but it makes clean upside continuation harder without a proper reclaim of structure.
If volatility remains bid, rallies into premium may face selling rather than clean continuation.
If volatility remains bid, I expect traders to sell recoveries into premium until the chart proves otherwise. Premium is where late buyers get tempted after the first bounce, and where institutions often rebalance exposure after a sharp repricing.
That does not mean every bounce should be shorted blindly. It means the burden of proof shifts to buyers. They need expansion through a bearish imbalance, acceptance above reclaimed liquidity, and a failure by sellers to create fresh lower highs.
How Does Market Structure Frame The 25,800 Liquidity Test?
SMC focus is whether price sweeps liquidity below the 25,800 area and then reclaims it, or accepts below it for continuation.
The 25,800 area is the near-term line I care about. Nasdaq is trading close to it at 25,819, so the market does not need a huge move to test sell-side liquidity. The first reaction below that area can expose whether the selloff is running stops or building acceptance lower.
In SMC terms, market structure is not just the last swing high and swing low on a chart. It is the behavior around liquidity, displacement, and acceptance. A brief raid under 25,800 followed by a strong recapture would suggest sellers chased too late. Holding below 25,800 would tell a different story.
A sweep-and-reclaim would suggest trapped shorts and potential short-covering toward the 26,000-26,100 zone.
A sweep and reclaim under 25,800 could set up a short-covering move toward 26,000 to 26,100. That zone is close enough to be realistic from current price, but still far enough to require actual buying pressure rather than passive mean reversion.
I’ve seen this pattern many times in index futures and cash index proxies: price tags obvious sell stops, stalls for a few candles, then expands back through the broken level as late shorts get squeezed. The key is speed. A lazy reclaim without follow-through usually lacks the energy needed to punish sellers.
Acceptance below 25,800 keeps sellers in control and opens the path toward deeper intraday discount.
Acceptance below 25,800 keeps the bearish case active. In that condition, traders should look for lower highs, failed retests, and weak bounces into prior breakdown areas. The market would be telling us that sell-side liquidity was not enough to attract durable demand.
My read: 25,800 is the active battleground. Above it, a squeeze toward 26,000-26,100 becomes credible. Below it, Nasdaq remains vulnerable to deeper discount as long as yields and VIX stay firm.
Where Does A Fair Value Gap Fit Into The Intraday Plan?
A bearish fair value gap formed during the selloff can act as a premium repricing area if price bounces from intraday discount.
A bearish fair value gap created during the selloff gives traders a practical reference point. When price moves quickly lower, it often leaves an imbalance where selling pressure was aggressive and two-way trade was thin. A bounce back into that area can become a premium repricing opportunity.
The mistake is treating every gap fill as a short. I want context first. Where is price relative to 25,800? Is VIX still rising? Are treasury yields still pressuring growth? Are buyers showing displacement, or only drifting into resistance?
Traders should watch whether any recovery into imbalance is rejected or converted into support through displacement and acceptance.
A recovery into imbalance has two possible messages. Rejection says sellers are still defending premium. Acceptance says the market is repairing the downside move and forcing shorts to cover. The candles themselves matter less than the reaction around the area.
For Nasdaq, the stronger bullish read would be a liquidity grab below 25,800, followed by expansion back above the level, then acceptance inside or above the nearest bearish imbalance. That would show a change in behavior. Until then, rallies deserve skepticism.
Clean displacement above the nearest bearish imbalance would strengthen the case for a short-covering move.
Clean displacement above the nearest bearish imbalance would shift the intraday tone. I want to see impulsive buying, not a slow crawl. A decisive move would suggest trapped shorts are starting to cover and sidelined buyers are being forced to participate.
For traders who want a recent Nasdaq context piece, the earlier Nasdaq analysis on AI-related tech pressure is useful background. The current tape is different because yields, VIX, and the dollar are all part of the pressure mix, but the same liquidity principles apply.
Bullish And Bearish SMC Scenarios To Watch
Bullish case: liquidity sweep below 25,800, fast reclaim, and sustained acceptance back toward 26,000-26,100.
The bullish case is simple, but it needs confirmation. Price runs below 25,800, fails to attract continuation selling, then reclaims the level with strong expansion. After that, buyers need to hold acceptance above the reclaimed zone long enough to target 26,000 to 26,100.
That would not make the entire market risk-on again. It would create a tradable short-covering window. There is a difference. With the 10Y yield at 4.567% and VIX at 17.59, I would still treat upside as a tactical move unless macro pressure cools.
Bearish case: failure to reclaim 25,800, continued VIX strength, and yield pressure driving lower-high formations.
The bearish case remains alive while Nasdaq struggles around 25,800 and fails to reclaim it with authority. Continued VIX strength would support that read. So would another push higher in yields or further dollar strength from the DXY near 101.22.
Lower highs below the reclaimed liquidity zone would be the cleaner sell-side structure. In that scenario, Nasdaq liquidity below the market becomes the magnet, and bounces into imbalance are more likely to meet supply than fresh demand.
Invalidation logic should follow market structure, not emotion: wait for displacement, acceptance, and liquidity behavior before acting.
Invalidation should come from market structure, not from frustration. A trader shorting into the hole needs to know what proves the trade wrong. A trader buying the dip needs to know what confirms the market has stopped accepting lower prices.
- Bulls need: a stop-run below 25,800, reclaim, and acceptance above the broken level.
- Bears need: failed reclaim attempts, lower highs, and continued pressure from yields and volatility.
- Neutral traders need: patience until price gives a cleaner reaction around the liquidity zone.
The next meaningful signal should come from how Nasdaq behaves around 25,800. Does price raid sell-side liquidity and snap back, or does it settle below the level and invite another leg lower? That is the question I’d want answered before pressing risk.
FAQ
Why is the Nasdaq Composite underperforming today?
The Nasdaq Composite is underperforming because higher treasury yields, a firmer dollar, and rising volatility are pressuring long-duration tech. With the index near 25,819 and down 1.2%, weakness is concentrated in higher-beta growth exposure rather than evenly spread across all major U.S. benchmarks.
How do treasury yields affect Nasdaq Composite analysis?
Treasury yields matter because technology and growth stocks are sensitive to discount-rate changes. When the U.S. 10Y yield rises to 4.567%, future earnings are discounted more heavily, reducing appetite for long-duration equities and weakening Nasdaq liquidity during risk-off trading conditions. Rate context can also be monitored through broad macro quote pages such as Trading Economics U.S. market data.
What does the VIX rising to 17.59 signal for traders?
A VIX rise to 17.59, up 9.1%, signals increased demand for downside protection. In Nasdaq Composite analysis, that usually means traders should be cautious with dip-buying because volatility expansion can turn small bounces into lower-high setups when buyers fail to reclaim key liquidity zones.
Why is the 25,800 area important for Nasdaq liquidity?
The 25,800 area matters because it is the nearby intraday sell-side liquidity zone traders are watching. A sweep below it followed by a reclaim could trigger short-covering, while acceptance below it would suggest sellers remain in control and price may seek deeper discount.
What would shift the Nasdaq from bearish to short-covering?
A cleaner short-covering setup would require price to reclaim the 25,800 area and hold above it with displacement. If that occurs, Nasdaq could rotate toward 26,000-26,100. Without that reclaim, market structure remains vulnerable to continued selling pressure.
For now, I’m treating 25,800 as the decision point and watching whether yields, VIX, and the dollar keep leaning on tech. Are you looking for the sweep and reclaim, or waiting for acceptance below before getting involved?
Disclaimer: This analysis is for educational purposes only and is not financial advice. Trade with your own risk plan.