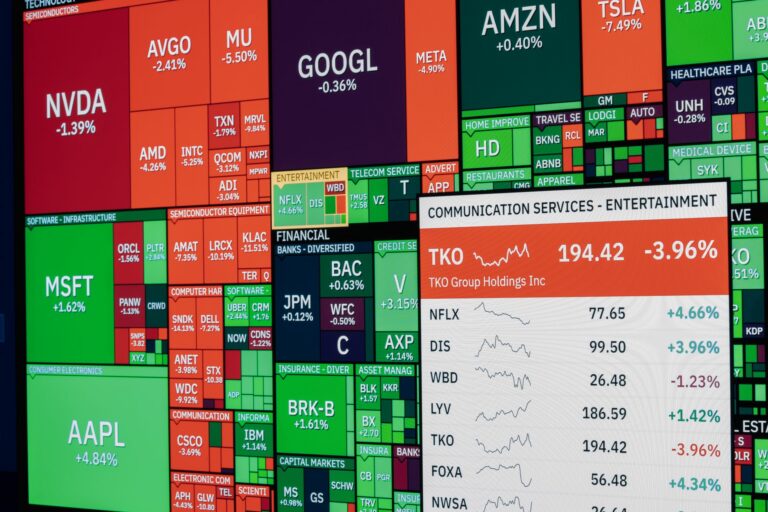
The Nasdaq Composite is trading near 25,882, down 1.5%, and the tape has the feel of crowded AI exposure being forced through a narrower exit. This Nasdaq Composite analysis starts with one simple read: sellers are leaning on growth, chip stocks are losing sponsorship, and the VIX spike says hedging demand is no longer quiet.
Nasdaq Composite Analysis: Risk-Off Pressure Leads Equities
Nasdaq is the clear equity laggard near 25,882
The live read is straightforward. Nasdaq Composite sits near 25,882, down 1.5%, making it the heaviest major US equity index in this snapshot. The S&P 500 is down 0.5% at 7,534, while the Dow Jones Industrial Average is down 0.2% at 52,553. That spread matters.
When Nasdaq leads the downside while the Dow barely moves, the market is not selling everything equally. It is targeting duration, growth, and the AI leadership complex that carried the prior advance. That gives this move a different character than a broad mechanical rebalance.
I treat this kind of divergence as a warning shot. In my experience, when tech underperforms while volatility rises, the first bounce often looks cleaner than it really is. The candles can recover intraday, but the order flow underneath is frequently long liquidation rather than fresh accumulation.
Relative weakness confirms the pressure is concentrated in tech
The relative weakness is the point. Nasdaq down 1.5% against a 0.5% S&P decline and a 0.2% Dow slip tells me the pain is concentrated where positioning was most aggressive. That is usually where the market hunts liquidity first.
Recent equity headlines have leaned heavily on earnings and the AI trade. Yahoo Finance noted that ASML helped buoy the AI trade as earnings rolled in, which is useful context because leadership narratives can reverse hard when the same group stops confirming upside. Momentum is powerful on the way up. It is unforgiving when crowded longs start de-risking.
For readers who track institutional-style price behavior, I would put this session in the SMC trading strategies bucket rather than a basic moving-average pullback. The issue is not whether Nasdaq is red. The issue is where liquidity sits, who is trapped, and whether sellers can defend lower value.
The core thesis is an AI long unwind
My core view is that crowded AI longs are being punished as chip selling, protection demand, and macro pressure drag the index toward downside liquidity. That does not mean the long-term AI theme is dead. I think that would be lazy analysis. It means the near-term structure has shifted from “buy strength” to “prove demand at the lows.”
That difference changes execution. Momentum traders who bought breakouts now have to decide whether to hold through a volatility expansion. Portfolio managers with too much AI concentration may sell rallies to get exposure back in line. Short-term traders see that behavior and start fading weak bounces. The feedback loop can move faster than fundamentals.
My read: Nasdaq does not need a macro disaster to keep sliding. It only needs crowded AI holders to stop adding and start using strength as an exit.
Why Is the Nasdaq Selloff Hitting AI and Chip Stocks Hardest?
Semiconductor weakness is the main equity story
The Nasdaq selloff is hitting AI and chip stocks hardest because they were the leadership group. When the strongest names become the source of supply, index-level damage follows. Chip stocks do not just influence sentiment. They sit inside the earnings story, the capex story, the AI infrastructure story, and the multiple expansion story.
That is why semiconductor weakness can weigh on the whole Nasdaq even when the broader tape looks less dramatic. Traders use the chip complex as a proxy for AI demand. When those names roll over, the market starts questioning whether the prior rally priced in too much perfection.
There is also a mechanical side. AI-related winners attracted systematic flows, options activity, retail attention, and institutional overweighting. The more a group becomes the consensus long, the more fragile it becomes near the first real break in market structure.
Crowded positioning changes the behavior of every bounce
Crowded positioning matters because trapped longs often behave differently after an intraday breakdown. They do not automatically add on the first dip. Many reduce exposure into bounces, especially when volatility is rising and leadership is no longer broadening.
That is how supply gets layered above price. Nasdaq can bounce 100 or 200 points from a low and still be vulnerable if the bounce runs directly into holders looking to lighten up. From a broader market analysis perspective, the first rally after a leadership break is often a test of seller intent rather than proof that the decline is over.
The key is displacement. A weak bounce into prior intraday support, followed by rejection, tells me sellers are still in control. A stronger recovery that reclaims the failed area and holds above it changes the conversation. Until then, I assume bounces are guilty until proven otherwise.
Earnings risk is competing with the AI growth narrative
Earnings risk is now competing with the AI growth narrative. That matters because multiple-rich tech stocks need confidence, not merely decent numbers. When valuations are stretched, “good” can be sold if guidance, margins, backlog, or capex language disappoints.
Investopedia reported that major indexes had recently finished higher after an earnings flurry and a softer wholesale inflation reading. That backdrop helps explain why traders had room to price optimism. But optimism becomes a liability when leadership stops confirming.
My opinion is blunt: tech bulls do not want a market where the Dow is stable, yields are lower, and Nasdaq still cannot catch a bid. That is a positioning problem, not a simple macro excuse.
What Does the VIX Spike Say About the Risk-Off Market?
VIX at 18.66 shows protection demand is back
The VIX is up 11.5% to 18.66. That is not panic, but it is a clear shift from complacency. Traders are paying up for protection rather than chasing upside momentum, and that changes how Nasdaq bounces behave.
A rising VIX often means options hedging becomes more important intraday. Dealers, funds, and short-volatility players can all affect the tape once volatility expands. The result is a market that feels heavier near resistance and faster on breaks.
The Nasdaq Composite does not need the VIX at crisis levels to struggle. A move from quiet volatility into a bid volatility regime can be enough to cap rallies, especially when the selling pressure is focused on a crowded leadership group.
The risk-off signal is broader than volatility alone
The risk off market signal is confirmed by Nasdaq underperformance versus the S&P 500 and Dow. Volatility alone can give false signals. Cross-market confirmation gives the move more weight.
Gold is down 0.5% at $3,971.60, Bitcoin is down 1.3% at $63,070, and Ethereum is down 2.3% at $1,829. Meanwhile, WTI crude is up 2.3% at $80.80. That mix is not a clean “sell everything” panic, but it does show a defensive tone with pressure on speculative and duration-sensitive exposure.
The US Dollar Index is only up 0.1% at 100.83, so this is not being driven by a violent dollar squeeze. It is more focused than that. Nasdaq is the pressure point.
A sustained volatility bid can keep rallies capped
A sustained VIX bid can keep rallies capped because hedging demand changes the rhythm of the day. Buyers become less willing to chase. Sellers become more confident fading rallies. Stops sit closer. Liquidity thins out near obvious levels.
That is why I do not treat every oversold bounce as a long setup. Weak markets can bounce sharply and still remain bearish. The better question is whether price can reclaim broken structure and hold it while volatility cools.
For traders using SMC trading strategies, the volatility backdrop should affect position sizing as much as direction. A clean level is still dangerous when the VIX is expanding and leadership is unwinding.
Why Aren’t Lower 10Y Yields Helping Tech?
The 10Y yield is lower, but Nasdaq is still heavy
The US 10Y Treasury yield is down 0.8% to 4.533%, but that rate relief is not giving Nasdaq much support. Under normal conditions, lower yields can help long-duration tech because future earnings get discounted less harshly. That relationship is not working cleanly here.
When a normally supportive input fails to support price, I pay attention. It tells me another force is dominating. In this case, the stronger force appears to be positioning stress, chip-sector selling, and earnings risk.
Reuters has reported on the dollar trading near a one-month low as cooling inflation affected Fed-hike expectations. Softer rate pressure may help the broader backdrop, but Nasdaq’s current tape says equity-specific liquidation is leading the day.
Positioning stress is overpowering rate relief
That divergence is important. Nasdaq is down 1.5% near 25,882 even with the 10Y yield lower. Traders who only watch rates may be tempted to buy the dip too early. I would rather see proof that sellers are done pressing the weak side.
In a crowded unwind, discount-rate logic takes a back seat. Funds reduce gross exposure. Options hedges get adjusted. Short-term players sell failed rebounds. The market can ignore supportive macro data until forced selling runs its course.
That does not mean yields no longer matter. They do. But right now, the tape is saying that lower yields are not enough by themselves.
Oil strength keeps inflation and margin pressure alive
WTI crude at $80.80, up 2.3%, adds another layer. Higher oil can keep inflation concerns alive and pressure margins in parts of the economy. For long-duration tech multiples, that is not the cleanest backdrop.
Nasdaq bulls would prefer lower yields, calm oil, easing volatility, and firm chip leadership. They have one of those pieces with the 10Y lower, but the rest of the board is not cooperating. That weakens the case for aggressive dip-buying before structure improves.
Related cross-asset reads matter here. Oil strength has its own risk channel, and traders can compare the equity move with WTI crude oil analysis to see how energy pressure is feeding into broader sentiment.
Where Is Downside Liquidity in the Market Structure?
The 25,750-25,850 pocket is the first major test
From an SMC lens, the immediate downside liquidity pocket sits around 25,750-25,850, just below the current Nasdaq Composite area near 25,882. That zone is close enough to matter immediately. It likely contains sell stops from late longs, intraday breakout buyers, and anyone defending the prior range.
A raid into that zone is not automatically bearish. The reaction matters. A sharp sweep below the pocket, followed by a recapture and acceptance back above 25,850, would tell me sellers failed to maintain control at downside liquidity.
Acceptance below 25,750 would be different. That would suggest the stop-run is not just a liquidity grab, but a continuation break with room for deeper imbalance fills.
A sweep and reclaim would be more constructive than a blind dip-buy
I do not like blindly buying the first touch of a liquidity pool when volatility is rising. The better trade often comes after the market shows its hand. Let price take liquidity, let sellers press, then watch whether demand steps in with real displacement.
That is the cleaner reversal profile: stop-run, reclaim, hold. Simple, but not easy. Most traders get trapped because they enter before the grab or chase after the recovery has already stretched.
The first sign of improvement would be Nasdaq holding above the 25,750-25,850 pocket after testing it. The second would be a push back toward broken intraday structure with volatility easing. Without those pieces, the bounce remains suspect.
Near-term supply sits around 26,100-26,250
Near-term supply sits around 26,100-26,250. That area is close enough to be tested on a relief bounce, and it is exactly where trapped longs may look to reduce risk after the breakdown.
That zone should be treated as a decision area rather than a target to celebrate. A weak push into 26,100-26,250 followed by rejection would confirm that sellers are defending the failed structure. A strong reclaim and hold above it would force shorts to reassess.
For now, Nasdaq is trading below that supply band, which keeps the burden of proof on buyers.
How Should Traders Frame the Near-Term Trade Plan?
Bearish continuation needs acceptance below liquidity
The bearish continuation setup is acceptance below the 25,750-25,850 liquidity pocket. That would keep sellers in control and expose deeper downside inefficiencies. I would want to see price trade below the zone, fail to reclaim it, and then use the underside as resistance.
Volume and volatility matter. A break lower on expanding volume with the VIX still firm carries more weight than a quick wick through the level. A slow drift is easier to fade. A clean expansion lower deserves respect.
The bearish case is strongest while Nasdaq remains below 26,100-26,250 and volatility stays bid. That combination tells me rallies are still being sold.
Constructive reversal requires a failed sell-side break
The constructive reversal setup is a sweep below the downside pocket, followed by a reclaim and a hold above it. That would show sellers found liquidity but failed to extend. In SMC terms, the stop-run would become fuel for the other side.
I would then watch how price behaves on the first pullback after the reclaim. Strong markets do not need to keep retesting the lows. They absorb supply higher and start building higher lows.
A move back toward 26,100-26,250 would be the next test. Buyers need to do more than bounce. They need to recapture supply and prove the breakdown was a failed auction.
Confirmation beats prediction in this tape
The execution rule is simple: wait for confirmation through market structure, volume, and volatility behavior before treating weakness as opportunity. That is especially true with chip stocks under pressure and the VIX up double digits on the session.
My preferred approach is patience around the liquidity pocket. Let the market reveal whether 25,750-25,850 is a trap for sellers or a doorway into lower prices. Guessing before that decision is made is how traders donate P&L to noise.
For broader context across assets, I would keep an eye on gold price analysis around yields and other macro-sensitive markets. Nasdaq is the chosen instrument here, but risk appetite is never isolated for long.
FAQ
What is driving the Nasdaq Composite selloff today?
The Nasdaq selloff is being driven by risk-off positioning, chip stock weakness, and crowded AI long unwinds. The index is down 1.5% near 25,882, underperforming the S&P 500 at 7,534 and the Dow at 52,553 as traders reduce exposure to growth and tech leadership.
Why are chip stocks so important for this Nasdaq Composite analysis?
Chip stocks matter because they were central to the AI-led rally and now sit at the center of the unwind. When semiconductor names sell off, the same mega-cap and AI-linked leadership groups lose sponsorship, creating heavier pressure on Nasdaq than broader equity benchmarks.
What does the VIX spike mean for traders?
The VIX spike to 18.66, up 11.5%, signals rising demand for protection. That usually reflects a risk off market where traders prioritize hedging over chasing upside. While volatility stays bid, Nasdaq bounces may face supply faster than usual.
Where is the key downside liquidity area for Nasdaq?
The immediate SMC downside liquidity pocket is 25,750-25,850, sitting just below the current 25,882 area. A sweep and reclaim would be more constructive than a blind dip-buy, while acceptance below that zone would keep downside pressure active.
Why are lower Treasury yields not helping Nasdaq more?
The US 10Y yield is lower at 4.533%, but Nasdaq is still weak because positioning and earnings risk are dominating rate relief. When crowded AI longs unwind and chip stocks sell off, lower yields alone may not be enough to stabilize market structure.
The forward read is clean: watch 25,750-25,850 for the next real decision, then judge the reaction instead of the headline. Are buyers going to defend downside liquidity, or is the AI unwind still hunting lower levels?
Disclaimer: This analysis is for educational purposes only and is not financial advice. Trade with your own plan and risk controls.