WTI is trading at $80.81, up 3.4% intraday, and the tape has shifted from normal commodity volatility into headline-driven supply repricing. This WTI crude oil analysis has one clean starting point: the crude oil price is being bid because traders are paying for Hormuz disruption risk before they know how much physical flow is actually affected.
I don’t treat that kind of move like a standard breakout. A geopolitical impulse can run further than technical traders expect, then reverse violently when the next headline softens the threat. That means structure matters, but timing matters even more.
Market Snapshot: WTI Leads On Hormuz Supply Shock
WTI trades at $80.81, up 3.4% intraday
WTI Crude Oil is the strongest major mover on the board at $80.81, gaining 3.4% on the session. That’s not a small push. For crude, a move of that size near the $80 handle tells me the market is adding a real geopolitical premium rather than simply drifting with broader dollar weakness.
Gold is also higher at $4,090.60, up 2.1%, which supports the idea that traders are paying for protection. Energy and gold rising together usually points to stress, not clean growth optimism. Bitcoin is up 2.1% and Ethereum is up 4.6%, but I’d be careful reading that as broad risk appetite when equities are clearly softer.
For traders tracking broader cross-asset positioning, I’d pair this oil move with more market analysis rather than view WTI in isolation. Oil can lead, but it can also become a temporary stress proxy when geopolitical headlines dominate.
US-Iran escalation and Hormuz closure reports are the catalyst
The direct driver is the latest wave of US-Iran escalation headlines, including market reports that Iran says Hormuz is closed. MarketWatch’s live coverage tied weaker equity futures and rising oil prices to reports around Iran, Hormuz, and renewed US-Iran strikes. That is exactly the kind of headline that forces crude traders to reprice before confirmation flows through shipping data.
That distinction matters. The market is not waiting for a fully measured supply deficit. It is pricing the risk that transit, insurance, loading schedules, or tanker routing could get disrupted. Crude moves first, analysts update models later.
The rally is geopolitical premium, not a clean risk-on impulse
The crude bid does not look like a broad demand rally. Equities are down, yields are softer, and the dollar is weaker. That combination tells me the oil move is more about perceived supply scarcity than expanding global growth expectations.
My clear opinion: traders who chase this candle without a defined invalidation level are late. The move can absolutely extend, but crude oil price action around geopolitical events punishes sloppy entries. I’d rather miss the first push than buy directly into a buy-side liquidity pocket after a vertical expansion.
Why Is WTI Crude Oil Jumping Today?
Hormuz oil risk sits at the center of the move
Hormuz oil risk matters because the Strait of Hormuz is one of the world’s most important energy transit routes. When traders hear closure language connected to Iran, they immediately mark up crude because a disruption there can affect a large share of seaborne oil flows.
Markets don’t need confirmed barrels offline to move. The risk premium can rise because shipping firms may reassess routing, insurers may widen premiums, and refiners may bid more aggressively for available barrels. That is why the first reaction often looks exaggerated on a chart. The market is paying for optionality under uncertainty.
Iran oil headlines force faster repricing than inventory data
Weekly inventory numbers are scheduled and digestible. Iran oil headlines are not. They hit the tape at random, and algorithms react before discretionary traders finish reading the sentence. That is the environment we’re trading right now.
The Sun Chronicle reported that Wall Street was mixed while oil prices jumped after Iran and the US traded another round of attacks. That framing fits the current tape: crude is reacting to potential supply disruption while equities struggle with the same geopolitical shock.
I’ve watched this pattern many times across oil, FX, and index futures. The first leg is usually emotional and fast. The second leg tells the truth. When price either accepts above the impulse zone or fails back through it, the real trade becomes cleaner.
Sustained repricing or headline spike?
The key question now is whether the market converts the shock into sustained supply repricing. A lasting move requires more than one dramatic headline. Traders will want evidence that shipping risk, export risk, or regional escalation remains elevated enough to keep crude supported above the prior value area.
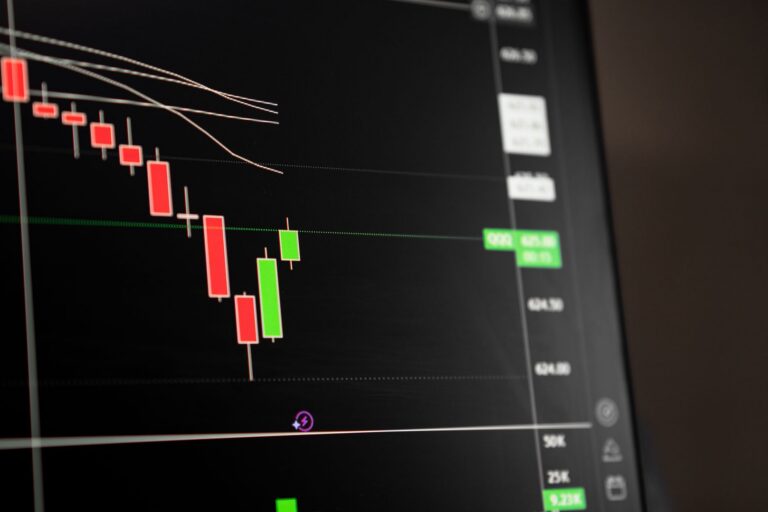
A headline spike behaves differently. It raids obvious liquidity, prints a strong candle, then stalls when late buyers run out of urgency. For WTI at $80.81, that makes the $80.80 area especially important. Acceptance above it keeps pressure on shorts. A quick failure back under it would suggest the market may have overpaid for the first wave of fear.
What Are Equities, Dollar, And Yields Signaling?
Equities are not confirming broad optimism
The S&P 500 is down 0.8% at 7,515, while the Nasdaq Composite is down 1.6% at 25,873. The Dow is holding up better, down 0.3% at 52,499, but that is still not a broad bullish confirmation. Equity traders are treating the shock as a risk event.
That matters for crude because oil rallies can come from very different sources. A demand-led rally often comes with firm equities, rising cyclicals, and stable credit sentiment. A supply-led rally can appear while equities weaken because higher energy prices act like a tax on consumers and margins.
For comparison, the latest S&P 500 analysis is useful because it shows how index liquidity can diverge from commodity strength when macro risk gets messy. The Nasdaq’s sharper drop also deserves attention, and traders can cross-check the tech-heavy tape through this Nasdaq analysis.
The US dollar is softer, adding a commodity tailwind
The US Dollar Index is down 0.5% at 100.74. A weaker dollar generally helps dollar-priced commodities because buyers using other currencies get a relative discount. That is a tailwind for crude, but I would not call it the main story.
The size and timing of the WTI move point more directly to supply risk. The dollar helps, but Hormuz is doing the heavy lifting. EUR/USD is up 0.6% at 1.1444, GBP/USD is up 0.5% at 1.3406, and USD/JPY is down 0.3% at 161.93, so the softer-dollar theme is visible across FX. Still, crude’s 3.4% rally is bigger than a normal FX translation move.
Lower 10Y yields say rates are not the driver
The US 10Y Treasury yield is at 4.575%, down 0.8%. Lower yields can support duration assets and sometimes commodities, but today’s crude strength is not being led by a rates-driven growth story. The VIX is also lower at 16.83, down 1.9%, which adds a wrinkle. Volatility markets are not screaming panic, yet oil and gold are trading like geopolitical hedges.
That mix is why I label the regime as mixed. Cross-asset confirmation is uneven. WTI has the cleanest catalyst, but the broader market has not aligned behind one simple macro narrative.
Smart Money Concepts: Liquidity Map Near $81.50-$82.00
WTI crude oil analysis around $80.80 acceptance
From a smart money concepts lens, the first question is whether WTI can accept above the $80.80 area after the impulse. Current price is $80.81, so this is not some distant level on a chart. It is the active decision zone.
Acceptance means more than a wick above the level. I want to see price hold, rotate, and continue to attract buyers without immediately snapping back below the breakout area. That tells me the market is comfortable doing business at higher prices.
A weak hold looks different. Price spikes, stalls, and starts closing back below the impulse midpoint. That kind of action warns that aggressive late longs may be trapped, especially after a fast geopolitical markup.
A push into $81.50 to $82.00 could be a liquidity grab
The $81.50 to $82.00 zone is where I expect buy-side liquidity to sit. It’s close enough to current price to matter, and it is obvious enough to attract breakout orders, buy stops, and momentum entries. Obvious levels are useful, but they are rarely generous.
A raid into that zone followed by rejection would suggest the market took buy-side liquidity before rotating lower. In SMC terms, I would then watch for displacement back under $80.80 and a failure to reclaim it. That sequence would change the character of the rally from supply repricing to a potential stop-run.
This is where patience pays. I don’t need to short the first tag of $81.50. I need evidence that the bid failed after taking liquidity. There’s a difference.
Acceptance above $80.80 keeps the supply shock in control
Sustained acceptance above $80.80 keeps bulls in control and supports the oil supply shock narrative. The market would be telling us that participants are willing to pay above the breakout area because the perceived disruption risk remains live.
That type of hold can create a stair-step move. Price expands, consolidates, then continues as late shorts cover and sidelined buyers chase pullbacks. In that environment, fading every push is usually expensive. The cleaner play is to wait for a retracement into a defended demand pocket or a confirmed continuation pattern.
Where Could WTI Breakout Risk Fail?
The $79.80 to $80.00 area is the first warning zone
The nearest downside area I’m watching is $79.80 to $80.00. A clean loss of that band would warn that the breakout is losing quality. It would also put WTI back below the psychological $80 handle, which can change short-term positioning quickly.
That zone matters because it sits just under the current impulse area. Bulls should want to defend it. A brief dip and recovery is one thing. A decisive break with expanding volume and weak rebounds would suggest sellers are gaining control.
In a headline market, I also care how price reaches the level. A controlled pullback into $79.80 to $80.00 can reset the move. A violent dump into that area after bullish news gets faded would be more concerning.
$78.40 is the deeper invalidation area
A deeper invalidation zone sits near $78.40. That is where bulls would need to defend higher-timeframe demand within the current structure. It is not my first downside target from $80.81, but it is the area I’d mark as the line where the bullish intraday structure starts to look damaged.
If price were to revisit $78.40, the question would no longer be whether WTI can extend the first Hormuz premium. The question would be whether the entire shock rally was absorbed and sold into. That would put trapped-long liquidation risk back on the table.
Failed zones shift focus to trapped-long liquidation
Failure below $79.80 to $80.00, followed by acceptance lower, would tell me the market is no longer rewarding late longs. From there, downside movement can accelerate because many traders enter geopolitical breakouts with wide emotions and tight actual stops.
That is a dangerous combination. Stops cluster below obvious intraday supports. Once those levels break, liquidation can become mechanical. The chart then moves from headline premium to position cleanup.
Trading Plan For An Oil Supply Shock Market
Bullish case: WTI holds above $80.80
The bullish case is straightforward. WTI holds above $80.80, buyers continue to defend pullbacks, and the market accepts higher prices as Hormuz supply risk remains priced in. That would keep pressure toward $81.50 to $82.00, with potential continuation if that zone is absorbed rather than rejected.
I would not chase a vertical candle into that area without a pullback or confirmation. The better bullish setup is a controlled retracement that holds above $80.80, then rotates higher with strong closes. That kind of structure gives a trader a logical invalidation point instead of relying on hope.
Bearish case: sweep, rejection, and loss of $80
The bearish case starts with a push into $81.50 to $82.00 that fails. The important part is the failure response. A rejection that drives price back below $80.80, then through $79.80 to $80.00, would suggest headline momentum is fading and buy-side liquidity has already been taken.
That is the setup where I’d expect trapped longs to become the fuel. Late buyers who entered on the Hormuz headline may have to exit into a thinner book, especially if follow-up news reduces the perceived closure risk.
Risk management matters more than prediction
Oil supply shock markets are not normal trend days. They gap. They reverse on one sentence. They punish oversized positions. Traders should define invalidation before entry and avoid placing stops exactly where everyone else can see them.
My practical framework is simple: map the liquidity, wait for acceptance or rejection, and size for the headline you haven’t seen yet. That is the only way I know to stay objective when the candle is moving faster than the commentary.
For WTI at $80.81, the decision zone is immediate. Bulls want acceptance above $80.80 and absorption near $81.50 to $82.00. Bears want a stop-run higher, rejection, and a clean loss of $79.80 to $80.00. Which side controls the next rotation will tell us whether this is a durable supply repricing or another geopolitical liquidity trap.
FAQ
What is the main takeaway from this WTI crude oil analysis?
The main takeaway is that WTI’s 3.4% jump to $80.81 is being driven by a geopolitical supply premium, not broad risk-on demand. Hormuz closure headlines and US-Iran escalation are forcing traders to reprice disruption risk while equities remain weak today.
Why does Hormuz oil risk matter for crude oil price?
The Strait of Hormuz is a critical transit route for global oil flows, so closure headlines immediately raise supply-risk premiums. Even before confirmed physical disruption, traders may bid crude oil price higher because potential delays, insurance costs, and shipping constraints can tighten expected availability.
Is the US Dollar driving today’s oil move?
The softer US Dollar Index at 100.74, down 0.5%, is a tailwind for dollar-priced commodities. However, the larger catalyst appears to be Iran oil headlines and Hormuz supply risk, because Treasury yields are lower and equities are not confirming a clean risk-on move.
What SMC levels matter for WTI now?
From a smart money concepts lens, $80.80 is the key acceptance area to watch. A liquidity sweep into $81.50 to $82.00 followed by rejection would warn of a trap, while $79.80 to $80.00 is the nearest downside area that could expose $78.40 if lost.
How should traders manage an oil supply shock setup?
Treat headline-driven oil supply shock moves as high-volatility conditions. Define invalidation before entry, avoid chasing candles near obvious liquidity, and wait for acceptance or rejection around mapped zones. Position size should reflect gap risk because fresh geopolitical updates can rapidly reprice WTI.
WTI’s next clean signal should come from how price behaves around $80.80 and the $81.50 to $82.00 liquidity band. Are buyers accepting a new supply premium, or did the market just pay up for fear at the worst possible location?
Disclaimer: This analysis is for educational purposes only and is not financial advice. Trading commodities involves substantial risk, especially during geopolitical headline events.