The S&P 500 is trading at 7,631, down 0.7% intraday, while the Nasdaq is off 1.0% and WTI crude is still parked near $89.73. That combination matters. This S&P 500 analysis starts with a simple read: equities are being pressured by higher real-world input costs, elevated bond yields, and a market that is drifting toward sell-side liquidity rather than expanding cleanly higher.
I’m treating 7,600 as the immediate line on the map. Not because round numbers are magical, but because price is close enough to make the liquidity around that area relevant for short-term positioning. With the US 10Y yield at 4.792%, DXY firm at 99.74, and VIX sitting at 16.29, the tape looks defensive without showing full panic. That’s often where traders get chopped up chasing candles instead of reading location.
S&P 500 Analysis: Risk-Off Flows Put 7,600 Liquidity In Play
S&P 500 Trades At 7,631, Down 0.7% Intraday
At 7,631, the S&P 500 is close enough to the 7,600 area that every reaction around it deserves attention. A 0.7% intraday drop is not a crash, but it is enough to shift short-term behavior. Buyers who were comfortable paying higher prices now have to decide whether they still want exposure with oil near $90 and yields refusing to break lower.
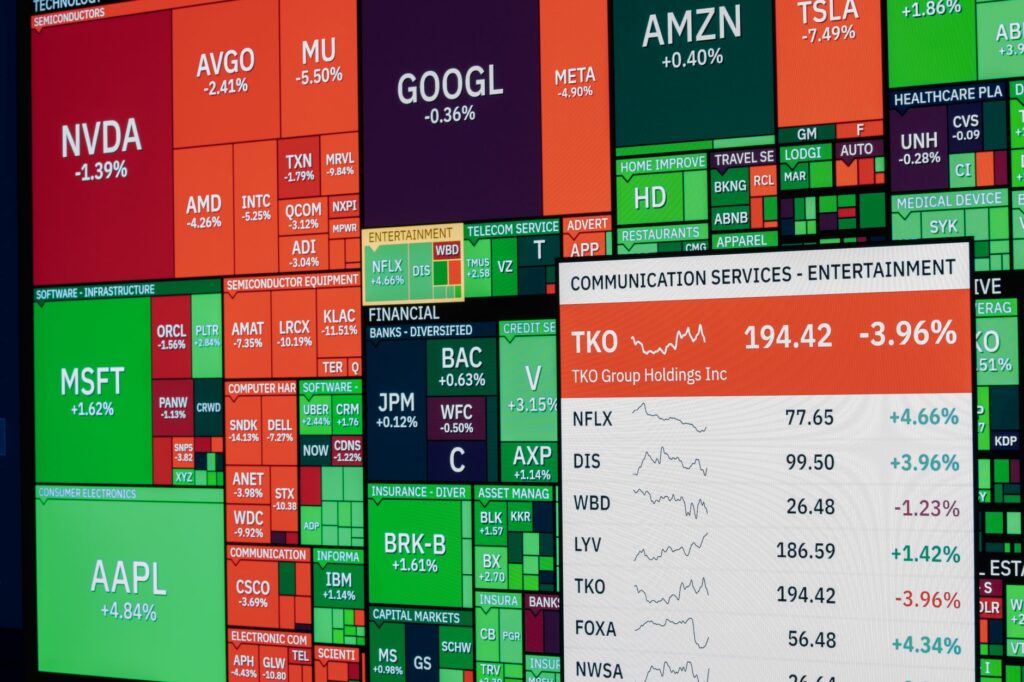
The current session fits a controlled risk-off stocks backdrop. The Dow is down 0.8%, Nasdaq is down 1.0%, Bitcoin is lower by 1.7%, and Ethereum is off 2.8%. That cross-asset tone tells me risk appetite has cooled across both traditional and speculative markets. Yahoo Finance also highlighted broad weakness across the Dow, S&P 500, and Nasdaq as oil remained a major pressure point for traders, which lines up with the live snapshot here tracking the stock market pullback.
Nasdaq Weakness Confirms Growth-Led Pressure
The Nasdaq Composite trading at 26,100, down 1.0%, gives the cleaner message. Growth is leading the weakness. That matters because high-multiple technology and AI-linked names are more sensitive to discount rates, real yields, and any shift away from duration exposure.
When the Nasdaq underperforms the S&P 500, I pay closer attention to whether the index is being dragged lower by genuine distribution or just a short-term de-risking rotation. Today’s action leans toward de-risking, but with a clear warning: growth buyers are not absorbing supply aggressively at current levels.
Why SPX Liquidity Matters More Than Candle Chasing
For traders using Smart Money Concepts, the better question is not “is the candle red?” It is where the red candle is delivering price. Right now, it is delivering SPX liquidity into the 7,600 neighborhood.
That is why I prefer mapping likely pools of stops and resting orders rather than reacting to every five-minute push. Sell-side liquidity under visible intraday lows can attract price before a stronger reaction forms. Traders who want a deeper framework can study our broader SMC trading strategies, especially the way structure and liquidity work together.
My read: 7,600 is not support until buyers prove it. It is a liquidity zone first, and a potential support level only after the market reacts.
How Are Bond Yields Pressuring Equity Multiples?
10Y Treasury Yield At 4.792% Keeps Discount Rates Elevated
The 10Y Treasury yield at 4.792% is the macro anchor behind the pressure. Equities can rally with high yields for stretches, but the tolerance gets thinner when yields keep rising or refuse to ease. A 4.792% benchmark makes Treasuries more competitive, tightens valuation math, and increases the hurdle rate for risk assets.
For the S&P 500, this is especially relevant because the index has a heavy concentration in long-duration growth exposure. When investors can earn a meaningful yield in government bonds, they often demand better prices before taking equity risk. That repricing tends to show up first in growth-heavy pockets, then in broader index structure.
Reports pointing to global bond yield pressure have also matched the equity weakness, including coverage from TradingView via Barchart on stocks retreating as yields surged as global bond yields stayed elevated.
Higher-For-Longer Fed Narrative Weighs On Duration Assets
The market is still fighting the higher-for-longer Fed narrative. That phrase gets overused, but the mechanism is real. Persistent inflation inputs, firm employment, and energy volatility reduce the urgency for policy easing. Equities dislike that because lower future rates are part of the bullish multiple-expansion story.
Duration assets, whether they are mega-cap tech stocks, speculative software names, or crypto, tend to feel this first. Bitcoin at $76,622 and Ethereum at $2,376 are also lower today, which supports the broader message. Risk capital is being pulled inward, not thrown at the highest-beta corners of the market.
Growth-Heavy Multiples Remain Sensitive To Yield Spikes
My opinion is blunt: this market can still trade higher later, but it does not deserve blind dip-buying while the 10Y is near 4.8% and oil is near $90. That is a tough mix for multiple expansion.
The practical issue is simple. When yields spike, the market has to reprice future earnings. Stocks with stronger current cash flow tend to hold up better than names valued mostly on distant growth. That shift can leave the index looking stable on the surface while internal leadership deteriorates underneath.
Why Does Oil Inflation Risk Matter For Stocks?
WTI Crude At $89.73 Keeps Inflation Pressure Alive
WTI crude at $89.73, down 0.5% on the session, remains too high to dismiss. The daily change is mild, but the level is the issue. Oil near $90 keeps oil inflation risk alive because energy flows through transportation, manufacturing, consumer expectations, and corporate margins.
That does not mean every uptick in crude automatically breaks equities. Markets are more nuanced than that. But sticky energy prices make it harder for inflation expectations to cool, and that complicates the Fed’s path. Traders watching crude can compare broader oil behavior with our WTI crude analysis for a cleaner read on energy market positioning.
Iran Risk Adds A Geopolitical Premium To Energy
Geopolitical risk is adding another layer. Benzinga noted pressure in S&P 500 and Nasdaq futures as US-Iran tensions escalated, with traders watching energy and risk assets closely during the Iran risk headlines. I do not trade headlines blindly, but I respect their ability to widen spreads and distort clean technical levels.
Oil markets can price geopolitical premium quickly. Equities then have to deal with the second-order effect: higher inflation risk, weaker consumer confidence, and a Fed that may have less flexibility.
Sticky Energy Prices Can Delay A Dovish Fed Pivot
The dovish pivot trade needs inflation confidence. Sticky energy prices work against that. Even when core inflation is the official focus, crude still influences the conversation because households feel fuel and transportation costs directly.
For the S&P 500, the problem is timing. The market wants lower rates before earnings momentum softens. Oil near $89.73 makes that path less comfortable. Add 10Y yields at 4.792%, and the index has less room for sloppy structure.
What Is The Market Structure Saying Right Now?
7,600 Area Marks The Near-Term Sell-Side Liquidity Focus
Market structure is leaning defensive while price trades at 7,631. The obvious nearby magnet is 7,600, where stops under recent intraday lows and short-term support references may be clustered. In SMC terms, that area can act as a draw on liquidity.
I’ve seen this pattern countless times across indices and forex: price grinds toward a visible level, retail traders label it support too early, and the actual decision comes after the stop-run. The first touch is rarely the full story. The reaction after the touch carries more information.
A Raid And Reclaim Would Signal A Potential Liquidity Sweep
A brief push below 7,600 followed by a strong recapture would change the tone. That type of move would suggest sellers were used as fuel rather than rewarded with continuation. I would want to see displacement back above the level, firm closes, and reduced follow-through from bears.
For traders who use order blocks, the key is to identify whether a clean bullish response forms from a prior demand area after liquidity is taken. Our guide on what an order block means in SMC trading explains that concept in more detail.
Acceptance Below 7,600 Opens The Path Toward 7,500 Demand
Acceptance below 7,600 would be a different message. Sustained trade under that zone, especially with Nasdaq still lagging and yields firm, would open the path toward 7,500 demand. That 7,500 level is not current price, but it is close enough to matter as the next downside reference if sellers gain control.
The cleanest bearish structure would include failed rebounds back into 7,600, lower highs on intraday time frames, and continued weakness from growth leaders. That would show sellers defending the breakdown rather than merely reacting to a liquidity grab.
DXY And VIX Show Controlled Risk-Off, Not Panic
DXY At 99.74 Shows Limited Rotation Into Risk Assets
DXY at 99.74, up 0.1%, is firm but not exploding higher. That matters because a stronger dollar often tightens global financial conditions and pressures risk assets. Today’s dollar move suggests capital is cautious, but we are not seeing an aggressive stampede into the greenback.
EUR/USD at 1.1580, GBP/USD at 1.3476, and USD/JPY at 159.55 add texture. The dollar is steady enough to keep pressure on risk, but not strong enough by itself to explain the whole equity move. The heavier drivers remain bond yields, oil inflation risk, and index structure.
VIX At 16.29 Signals Stress Without Capitulation
VIX at 16.29, down 0.3%, is the tell. Equity prices are lower, but implied volatility is not screaming panic. That creates a very different trading environment than a disorderly liquidation. Controlled selling usually gives cleaner technical reactions because participants are still making decisions, not dumping risk at any price.
This is one reason I am more interested in 7,600 and 7,690 than in dramatic macro calls. With VIX contained, price can still respect mapped levels. A panic regime would make those levels less reliable because forced flows tend to overwhelm structure.
Controlled Volatility Makes Key Liquidity Levels More Actionable
Controlled volatility gives SMC traders a better shot at reading intent. A sweep, reclaim, rejection, or failed retest has more signal when the market is not moving in a disorderly volatility shock. That does not remove risk. It just makes the tape more readable.
For broader index context beyond this setup, I’d keep an eye on our market analysis updates. The important thing is to keep the map flexible. A level is useful only while price behavior confirms it.
Key SMC Trading Scenarios For SPX Liquidity
Bullish Scenario: Clean Reclaim Above 7,690
The bullish scenario needs more than a small bounce. A clean reclaim above 7,690 would show buyers are taking back short-term control and forcing late shorts to cover. I would prefer to see the move come after either a sweep of 7,600 or a firm defense above it.
Above 7,690, the next question becomes whether the index can build acceptance rather than spike and fade. Stronger breadth, Nasdaq stabilization, and a softer 10Y yield would add confirmation. Without those, a reclaim can still fail.
Bearish Scenario: Failure Under 7,600
A failure under 7,600 puts 7,500 demand into focus. The bearish case becomes stronger with repeated rejection at 7,600 from below, continued Nasdaq underperformance, and bond yields staying close to the 4.792% area.
Oil also matters here. Crude holding near $89.73 keeps pressure on the inflation narrative. A fresh energy spike would likely make equity buyers more cautious, especially in growth-heavy sectors where valuation sensitivity is already high.
Decision Zone: Watch Reaction, Not Prediction
The decision zone is 7,600 to 7,690. That is where I want to see who shows up with conviction. Bulls need recapture and continuation. Bears need acceptance lower and failed rebounds. Everything between those two levels can become noise if traders force a bias too early.
- 7,600: near-term sell-side liquidity and reaction zone.
- 7,690: bullish reclaim level that would pressure shorts.
- 7,500: next demand reference if downside acceptance builds.
- 4.792% 10Y yield: macro pressure point for equity multiples.
- $89.73 WTI: inflation and geopolitical risk input.
The best traders I know do not need to predict every tick. They wait for price to reveal intent at the right location. That is the approach I favor here.
FAQ
What is driving today’s S&P 500 analysis?
Today’s S&P 500 analysis is driven by controlled risk-off conditions: the index trades near 7,631, Nasdaq is weaker, WTI sits near $89.73, and the 10Y yield remains around 4.792%. Those inputs pressure equity multiples and make nearby liquidity levels more important.
Why is oil near $90 a risk for stocks?
Oil near $90 keeps oil inflation risk alive because higher energy prices can flow into transportation, goods, and inflation expectations. Persistent energy costs can also pressure corporate margins. When inflation stays sticky, the Fed has less reason to ease quickly, which can keep discount rates elevated and weigh on growth-heavy equities.
How do bond yields affect SPX liquidity?
Elevated bond yields make cash and Treasuries more competitive versus equities, especially long-duration growth stocks. When the 10Y yield holds near 4.792%, traders often demand lower equity valuations, which can push price toward sell-side liquidity zones where larger participants may reassess risk.
Does VIX at 16.29 mean panic selling is underway?
No. A VIX reading near 16.29 points to controlled risk-off behavior rather than panic liquidation. That matters because orderly selling often respects liquidity maps better than emotional capitulation, making areas like 7,600 and 7,690 more useful for SMC-based decision-making.
What S&P 500 levels matter most now?
The key SMC levels are 7,600 for potential sell-side liquidity, 7,690 for a clean bullish reclaim, and 7,500 as the next demand zone if 7,600 fails. A raid and reclaim would favor a liquidity sweep; acceptance below 7,600 favors continuation lower.
The forward-looking takeaway is straightforward: as long as the S&P 500 trades near 7,631 with yields elevated and oil near $90, I’m watching 7,600 first and 7,690 second. Which side takes control of that range next?
Disclaimer: This article is for educational purposes only and is not financial advice, investment advice, or a recommendation to buy or sell any market.