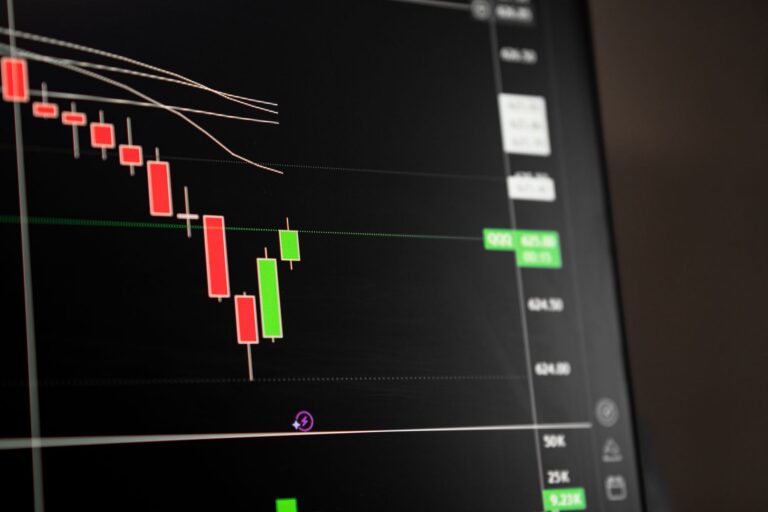
The Nasdaq Composite is sitting near 26,402, down 0.5% intraday, and this Nasdaq analysis starts with the pressure point that matters most: oil is ripping, treasury yields are elevated, and tech stocks are being forced to reprice liquidity instead of chasing momentum. WTI crude is up 3.4% at $86.21, the US 10Y yield is holding around 4.756%, and the VIX has jumped 6.7% to 15.39. That is a risk-off market mix, even with the dollar slightly softer at 99.57.
I’ve traded enough equity index sessions to respect this setup. When oil, yields, and volatility rise together, Nasdaq liquidity can disappear faster than traders expect. My opinion is simple: this is not the tape to blindly buy every red candle in mega-cap tech. Price needs to prove acceptance, not just print a small bounce.
Nasdaq Analysis Snapshot Near 26,402
Index trades down 0.5% intraday, holding near 26,402
The Nasdaq Composite is currently near 26,402, lower by 0.5% on the session. That decline is not dramatic by itself, but the context makes it important. The move is happening while WTI crude trades at $86.21 and treasury yields remain high enough to pressure long-duration assets.
For traders, 26,400 is the immediate reference point. Price is close enough to that level that short-term order flow can become noisy. Stops, resting bids, late shorts, and dip buyers are all likely clustered around the same area. That is exactly the kind of environment where Smart Money Concepts traders should watch reaction, not prediction.
For broader cross-market coverage, I keep an eye on more market analysis when index moves are being driven by macro pressure rather than isolated earnings news.
Strongest permitted mover outside commodities as tech absorbs pressure
Commodities are stealing the headline. WTI crude’s 3.4% jump is the loudest move on the board, while gold is down 0.9% near $4,490. Equities are softer, with the S&P 500 down 0.2%, the Dow flat near 53,560, and the Nasdaq underperforming at 26,402.
That underperformance matters because tech stocks are more sensitive to changes in discount rates and liquidity expectations. When investors get paid more to hold duration through treasury yields, the market becomes less forgiving toward stretched technology valuations. High-quality companies can still fall when positioning is crowded and risk appetite cools.
Tech profit-taking follows softer Nasdaq futures and broader US futures weakness
Weakness in US futures has been part of the backdrop, with oil strength weighing on sentiment after renewed Middle East hostility reports. Investopedia reported that stock futures slipped as oil jumped following renewed geopolitical tension, which fits the current risk tone.
Profit-taking in tech does not require a full panic. Sometimes the first leg is just managers reducing exposure, short-term traders taking gains, and volatility desks adjusting hedges. The market can look calm on the surface while internal liquidity thins. That is why I care less about one candle and more about whether the Nasdaq can hold above or reclaim key intraday structure.
Why Is The Nasdaq Slipping Today?
WTI crude jumps 3.4% to $86.21 after renewed Middle East hostility reports
WTI crude is trading at $86.21, up 3.4%, and that move is the core macro shock behind the weaker risk tone. Higher oil prices feed inflation concern, especially when the market is already debating whether rates can stay elevated longer than equity bulls want.
The Nasdaq does not have oil producers sitting at the center of the index, but energy still matters. A crude spike can pressure margins, lift inflation expectations, complicate central bank policy, and make investors less willing to pay premium multiples for growth. That chain reaction hits tech through liquidity and valuation, not through direct commodity exposure.
For traders tracking the energy side of the move, the recent WTI crude oil pullback analysis is useful context because crude has become a major driver of index sentiment again.
Oil-led inflation risk challenges the soft-landing narrative
The soft-landing story needs controlled inflation, stable yields, and resilient earnings. An oil spike challenges the first part of that equation. Even when core inflation data looks less threatening, a fast energy move can change consumer expectations and keep policymakers cautious.
That creates a problem for tech stocks. Much of the Nasdaq’s strength often depends on confidence that future earnings deserve a high present value. When inflation risk reappears, investors start asking harder questions about margins, borrowing costs, and terminal rates. That shift can be enough to turn a bullish tape into a defensive one.
Elevated treasury yields pressure long-duration tech stocks
The US 10Y Treasury yield is near 4.756%, up 0.7% in the current snapshot. That level is high enough to keep pressure on long-duration equities, especially growth names whose valuation depends heavily on cash flows expected far into the future.
Higher yields do not automatically crash the Nasdaq. Markets can rally with elevated rates when earnings momentum, breadth, and liquidity are strong. The issue now is the combination: oil is up, VIX is higher, futures are softer, and the Nasdaq is already slipping near a sensitive liquidity zone. That is a different tape than a clean risk-on breakout.
How Do Treasury Yields Affect Nasdaq Liquidity?
US 10Y yield holds elevated at 4.756%
The 10Y yield at 4.756% is the rate traders should keep on the screen next to Nasdaq price action. A small intraday change in yields can matter when the index is sitting near 26,400 and trying to decide whether to defend support or accept lower.
Swissinfo noted the tension between treasury yields, steady stocks, and rising oil, and that is the same cross-asset pressure showing up here. Equity traders cannot treat the Nasdaq as an isolated chart when rates and commodities are driving risk appetite.
Higher discount rates compress tech valuation multiples
Tech stocks are often priced on future growth. That makes them more vulnerable when the discount rate rises. As treasury yields climb, investors can demand a higher return from equities, which usually means lower acceptable valuation multiples unless earnings growth accelerates enough to compensate.
This matters most in the expensive parts of the market. A mega-cap technology name with strong free cash flow can handle higher rates better than a speculative growth stock, but both live inside the same liquidity environment. When index-level selling starts, baskets move together before investors separate quality from excess.
Liquidity conditions tighten when yields rise faster than risk appetite
Nasdaq liquidity is not only about order book depth. It is also about willingness to take risk. When yields rise faster than risk appetite, buyers become more selective, market makers widen spreads, and dip-buying loses urgency.
That is why a 0.5% decline near 26,402 deserves attention. The percentage move is modest, but the structure is vulnerable. Buyers need to show they are willing to absorb supply above 26,400 and then push through 26,550. Until that happens, rallies can become liquidity for sellers rather than evidence of a durable recovery.
Risk-Off Market Signals To Watch
VIX rises 6.7% to 15.39, showing stronger demand for downside protection
The VIX is up 6.7% at 15.39. That is not a crisis reading, but it does show a stronger bid for downside protection. In a risk-off market, volatility does not need to explode to pressure equities. A steady climb can be enough to change dealer positioning and make intraday rallies feel heavier.
I treat a rising VIX with elevated yields as a warning sign, especially when the Nasdaq is already underperforming the S&P 500 and Dow. The message is simple: protection is getting more expensive, and traders are less comfortable holding risk without confirmation.
DXY softens to 99.57 but fails to offset oil and yield pressure
The US Dollar Index is slightly lower at 99.57, down 0.1%. A softer dollar can help risk assets in some environments, particularly when it eases financial conditions and supports multinational earnings. That relief is limited here because oil and yields are doing more damage than the dollar is providing support.
EUR/USD is near 1.1595, GBP/USD is near 1.3537, and USD/JPY is around 159.87. Forex is not screaming panic, but the equity tape still leans defensive. Cross-asset confirmation is mixed, which makes market structure on the Nasdaq even more important.
Equities remain vulnerable while volatility and yields stay elevated
The S&P 500 is down 0.2% near 7,712, while the Dow is roughly flat around 53,560. That relative picture tells me the pressure is concentrated in duration-sensitive and growth-heavy areas. Nasdaq weakness is not random. It lines up with the macro inputs.
Crypto is also soft, with Bitcoin down 1.1% near $77,872 and Ethereum down 0.7% around $2,450. Risk appetite is not completely broken, but it is fading across speculative assets. Traders who also monitor digital assets can compare tone through more crypto analysis, since crypto often reacts quickly when liquidity expectations tighten.
SMC Market Structure Levels For Nasdaq
Liquidity sweep below the 26,400 area before any reclaim attempt
The 26,400 area is the immediate liquidity zone. Price is trading almost directly on top of it at 26,402, which means a brief push below the level could trigger stops before any serious bid appears. That is the classic setup for a liquidity raid, but only the reaction confirms it.
A shallow break below 26,400 followed by fast recapture and expansion through nearby lower-timeframe highs would tell me sellers failed to gain acceptance. I would want to see displacement, better breadth, and reduced pressure from yields before calling that move constructive. Without those ingredients, a stop-run can turn into simple continuation lower.
For traders working with Smart Money Concepts, the key is sequencing. First comes the grab, then the reclaim, then the shift in lower-timeframe market structure. The educational side of that process is covered in our SMC trading strategies section.
Acceptance lower opens 26,250 to 26,100 as the next intraday downside zone
Acceptance below 26,400 changes the map. The next downside area I would watch is 26,250 to 26,100, which sits within a reasonable intraday range from the current 26,402 spot. That zone is close enough to matter and far enough to attract sellers if the current support fails.
Price does not need to move in a straight line. Nasdaq can break down, rebound into 26,400, and still reject if supply remains heavy. That kind of retest often gives cleaner information than the first flush because traders can see whether buyers are defending lost ground or whether sellers are using the bounce to reload.
A clean reclaim above 26,550 would suggest a liquidity raid, not sustained distribution
The upside marker is 26,550. A clean move above that level after taking liquidity near 26,400 would suggest the earlier weakness was a raid rather than sustained distribution. I would want the move to show real expansion, not a slow grind with poor breadth and rising yields.
That 26,550 level is not magic. It is a practical line for intraday structure. Above it, trapped shorts can start covering, late sellers lose comfort, and buyers have a better argument that the index has rejected lower prices. Below it, the burden of proof stays on the bulls.
Bullish And Bearish Intraday Scenarios
Bullish case: reclaim 26,550 with displacement and improved breadth
The bullish scenario needs a recapture of 26,550 with strong expansion and improving breadth across major tech stocks. A dollar dip alone is not enough. Nasdaq bulls need yields to cool or at least stop rising, volatility to stabilize, and leadership to broaden beyond a handful of defensive mega-caps.
In that scenario, the move below 26,400 would look like engineered liquidity collection. Shorts who sold the break would be vulnerable, and price could rotate higher as those positions unwind. I would still avoid assuming a full trend day higher unless the macro pressure eases with it.
Bearish case: failure at 26,550 keeps lower-timeframe structure heavy
The bearish case is cleaner. Price fails below 26,550, rallies keep stalling, and sellers maintain control of lower-timeframe market structure. That would keep the 26,250 to 26,100 zone in play, especially while WTI crude stays firm and the 10Y yield holds near 4.756%.
Under that setup, bounces are suspect. They can still be tradable, but they are countertrend until proven otherwise. I would rather see buyers force a structural shift than guess at a bottom because the Nasdaq is down half a percent.
Neutral case: chop around 26,400 as traders wait for yield and oil confirmation
The neutral path is messy trade around 26,400. That would fit a market waiting for confirmation from oil, yields, and volatility. Chop can frustrate both sides because stop-runs happen in both directions without clean continuation.
This is where patience matters. A Nasdaq stuck around 26,400 while WTI holds $86.21 and VIX remains bid is not a high-conviction long backdrop for me. It is a tape for smaller size, tighter invalidation, and respect for macro headlines.
Comparable index pressure has also shown up in industrials, and the Dow Jones risk analysis offers a useful contrast because the Dow is currently holding flatter than the Nasdaq.
FAQ
What is the main takeaway from this Nasdaq analysis?
The Nasdaq Composite is slipping near 26,402 as rising oil prices and elevated treasury yields pressure tech stocks. The key issue is liquidity. Buyers need to reclaim 26,550 with convincing structure, or the risk-off market tone can keep the 26,250 to 26,100 downside zone active.
Why are higher treasury yields negative for tech stocks?
Higher treasury yields raise the discount rate applied to future earnings, which hurts long-duration growth stocks the most. With the US 10Y yield near 4.756%, investors may reduce exposure to expensive tech names and demand a larger risk premium before buying dips.
How does the oil spike affect Nasdaq liquidity?
WTI crude rising to $86.21 revives inflation concerns, which can keep rates elevated and reduce appetite for risk assets. Even though oil is not a Nasdaq component, higher energy-driven inflation risk tightens liquidity expectations and can trigger profit-taking across technology shares.
What SMC level matters most for the Nasdaq today?
The 26,400 area is the immediate liquidity zone to watch. A sweep below it followed by a strong reclaim could signal a liquidity raid. Acceptance below that area would keep sellers focused on 26,250 to 26,100 as the next downside range.
Does a softer dollar help the Nasdaq here?
A softer DXY at 99.57 offers some relief, but it is not enough to offset the stronger pressure from oil and yields. For Nasdaq bulls, the more important signal is whether yields cool and price reclaims 26,550 with convincing market structure.
The next clean signal should come from the interaction between 26,400 and 26,550. Do buyers turn a stop-run into a reclaim, or does elevated oil and yield pressure keep tech heavy into the next session?
Disclaimer: This article is for educational purposes only and is not financial advice, investment advice, or a recommendation to buy or sell any asset.