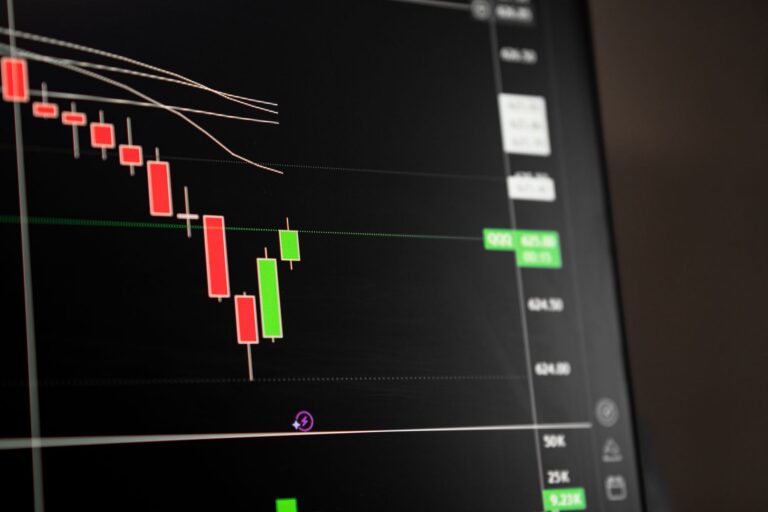
Gold is trading at $4,661.60, up 2.0% intraday, while the US 10-year yield sits higher at 4.736%. That combination matters. My Gold SMC analysis reads this as a clean relative-strength signal, because XAU/USD is advancing even while real-money yield pressure should be a headwind. The immediate fight is now obvious: can buyers run the $4,680 to $4,700 buy-side pool, and more importantly, can they hold above it?
The live board is risk-on, with the VIX down to 15.13 and US equity indices green, but gold is still leading the positive side of the snapshot. That is not normal defensive-only behavior. It looks more like a mix of dollar hedge demand, liquidity pursuit, and momentum positioning into a nearby stop cluster.
Gold SMC Analysis: Why Is Gold Leading While Yields Rise?
Gold trades at $4,661.60, up 2.0% intraday, making it the strongest allowed mover on the board.
Gold’s position on the board is the first thing I care about. XAU/USD is at $4,661.60 and up 2.0%, which makes it the strongest positive mover among the listed major markets in the live snapshot. The Dow is up 1.0%, the S&P 500 and Nasdaq are each up 0.4%, while Bitcoin and Ethereum are slightly red. That matters because gold is not simply drifting with broad risk sentiment.
From a smart money concepts trading framework, leadership matters because the strongest instrument often becomes the one that seeks the cleanest liquidity first. Gold has a clear nearby magnet above the market. The $4,680 to $4,700 zone is close enough that intraday traders cannot ignore it, and the current bid has enough strength to make that area active rather than theoretical.
I do not treat a 2.0% intraday rally in gold as background noise. In my experience, when XAU/USD pushes this hard while other risk assets are merely firm, the tape is usually telling you that positioning is unbalanced somewhere. Stops are exposed. Shorts are uncomfortable. Late buyers are tempted. That is exactly the kind of environment where clean levels get raided quickly.
The US 10-year yield is higher at 4.736%, up 0.8%, so XAU/USD strength is notable rather than automatic.
The yield backdrop keeps this setup honest. The US 10-year Treasury yield is at 4.736%, up 0.8%, and that usually applies pressure to gold because higher yields increase the opportunity cost of holding a non-yielding asset. A gold rally during falling yields is easy to explain. A gold rally during rising yields demands more respect.
That is why I’m not reading this as a lazy bullish move. The market is absorbing a macro headwind and still pressing higher. Reports such as TradingView’s coverage of yield pressure tied to crude and equities highlight how sensitive broader markets can be when yields rise. Gold ignoring part of that pressure tells me the bid has purpose.
The cleanest interpretation is that traders are paying more attention to dollar weakness and near-term liquidity than to the yield move alone. That can persist for a session, but it also makes confirmation more important. When yield pressure is present, weak breakouts tend to get punished faster.
Gold is attracting both defensive flow and dollar-hedge demand despite yield pressure.
Gold’s current tape has two demand streams. One is defensive allocation, the familiar bid that appears when investors want hard-asset exposure. The other is dollar-hedge demand, which is more tactical and more relevant for intraday XAU/USD price action. With DXY softer at 98.84, the currency side is giving gold room to move.
That blend can create aggressive expansion because different participants buy for different reasons. Macro funds may be hedging currency exposure. Short-term traders may be chasing momentum. SMC traders are watching the buy-side liquidity sitting just overhead. Three groups, one direction. That is the only rule-of-three I need here.
My opinion is clear: gold bulls have the better intraday argument while price holds above the first mitigation area, but they still need proof above $4,700. A raid into liquidity is not the same as acceptance.
What Does The DXY Gold Correlation Signal Today?
DXY is softer at 98.84, down 0.1%, giving gold room to extend toward nearby liquidity.
The US Dollar Index is trading at 98.84, down 0.1%. That is a small move, but context matters. Gold is already firm, yields are higher, and the dollar is not helping sellers. Even mild dollar softness can become enough fuel when XAU/USD is sitting within striking distance of obvious buy-side liquidity.
For broader currency context, Forex.com’s weekly technical outlook covering DXY, gold, and major FX pairs is a useful reference point, especially when gold and the dollar are both near levels that can affect short-term positioning. I do not outsource my trade decisions to outside commentary, but I do pay attention when multiple markets are clustering around technical inflection points.
At $4,661.60, XAU/USD does not need a major DXY breakdown to test $4,680 to $4,700. It only needs the dollar to remain heavy long enough for liquidity-seeking flow to finish the job.
The dxy gold correlation currently favors XAU/USD because dollar weakness is offsetting higher yields.
The dxy gold correlation is doing the heavy lifting right now. Higher yields should be a drag, yet gold is up sharply because the dollar side is not confirming the bearish yield signal. In plain trading terms, one macro input is pressing down, the other is allowing price to lift.
That conflict is exactly why I want traders to focus on reaction quality rather than headlines. A weaker dollar supports gold, but the best SMC read comes from how price behaves at liquidity. Does it expand through the level with conviction, or does it spike, stall, and rotate lower?
There is also a cross-market tone worth noting. Equity indices are positive and volatility is lower, which confirms a risk-on regime. Investopedia’s pre-market coverage is another reminder that traders are juggling stock strength, macro expectations, and rate sensitivity at the same time. Gold leading in that environment is useful information.
A renewed dollar bid would reduce the quality of any bullish continuation signal.
A stronger dollar would change the quality of the setup quickly. That does not mean gold must collapse, but it would make continuation above $4,700 harder to trust. I want bullish displacement to happen with the dollar staying soft or at least neutral. A sharp DXY rebound into the breakout would raise the odds of a stop-run rather than sustained demand.
For traders following broader market flow, the dollar should stay on the screen next to gold. I would also keep an eye on current macro coverage and cross-asset updates through more market analysis, because gold rarely moves in isolation when yields and DXY are both active.
XAU/USD Price Map: $4,680-$4,700 Buy-Side Liquidity
Immediate smart money concepts focus sits on buy-side liquidity above the $4,680-$4,700 zone.
The cleanest liquidity pool is above $4,680 to $4,700. That is where short stops, breakout orders, and momentum triggers are likely clustered. Smart money concepts traders should treat that band as the immediate decision zone, not a random resistance level drawn because it is round.
Gold is close enough that the market can reach the pool without needing a full macro shock. From $4,661.60, a push into $4,680 requires only a modest extension. A test of $4,700 would still be well within normal intraday expansion after a 2.0% move, especially with the dollar soft.
The danger is assuming that liquidity above price automatically means bullish continuation. Liquidity is a target first. Directional acceptance comes after.
Because spot is near $4,661.60, the liquidity pool is close enough to matter during today’s session.
Distance matters in intraday planning. A level 6% away may be useful for swing context, but it is not the first tactical decision point. Here, the buy-side band is roughly 0.4% to 0.8% above spot, depending on whether you focus on $4,680 or $4,700. That puts it directly in play.
The market does not need to create a new narrative to reach it. A modest continuation bid, a little dollar softness, or another wave of short covering can be enough. That is why I would avoid fading gold blindly before the pool is tested. The tape is too strong for casual countertrend entries.
The zone should be treated as a decision area, not an automatic breakout target or confirmed rejection level.
The $4,680 to $4,700 zone is where traders should slow down, not speed up. A clean move into the band gives information. A sloppy push gives different information. A fast wick above $4,700 with no acceptance gives a very different message.
I care about candle bodies, speed, and what happens after the first contact. Strong markets do not spend much time begging at liquidity. They attack, absorb, and continue. Weak continuation attempts often look impressive for a few minutes, then give the whole move back.
Gold Liquidity Sweep Or Clean Displacement Above $4,700?
A strong displacement through $4,700 would shift focus toward continuation and bullish acceptance.
A decisive expansion through $4,700 would put bullish acceptance on the table. The key is not simply printing above the level. I want to see body closes above the pool, limited upper-wick rejection, and follow-through that does not immediately collapse back into the prior range.
That type of move would tell me the market did more than harvest stops. It would suggest new buyers are willing to transact above the obvious level. Once acceptance forms, pullbacks toward the broken zone can become more informative than the initial breakout itself.
A continuation read would also strengthen if DXY remains pinned near 98.84 or drifts lower. Dollar weakness is the cleaner companion for a bullish gold breakout.
A wick above $4,700 followed by rejection would warn of a gold liquidity sweep rather than sustained demand.
A fast wick through $4,700 followed by rejection would carry a different message. That would look like a gold liquidity sweep, especially if price snaps back below $4,680 and fails to reclaim the level on the next attempt. A raid like that often traps late breakout buyers and gives larger players the fill they wanted.
The first rejection candle is only part of the read. The reaction after it matters more. Heavy selling, failed retests, and a return toward the $4,620 to $4,640 area would suggest the market completed the upside objective and is now repricing lower.
Candle close quality, follow-through, and reaction speed are the key confirmation filters.
Confirmation is not complicated, but traders often make it messy. I want body closes, continuation, and clean reactions. Wicks alone are weak evidence. A single candle above $4,700 that immediately fades is not the same as an accepted break.
Reaction speed is underrated. When a market raids liquidity and reverses hard, the failure usually does not need much time. When a market accepts above a major pool, sellers tend to look ineffective quickly. That difference can save traders from chasing the wrong side of the move.
Fair Value Gap Trading Plan For Pullbacks
The $4,620-$4,640 area is the first pullback zone to monitor for mitigation behavior.
The first downside area I care about is $4,620 to $4,640. That is the pullback band where buyers need to prove that the rally has structure beneath it. A controlled move into that zone can be healthy. A hard break through it with expanding sell-side pressure is something else entirely.
For fair value gap trading, I do not treat every imbalance as support. I want to see mitigation behavior. That means selling slows, candles compress, downside displacement fades, and buyers start defending the area without requiring a dramatic news catalyst.
Fair value gap trading focus should be on whether buyers defend imbalance or whether demand fails.
The imbalance zone is a test of demand quality. Buyers defending $4,620 to $4,640 after an upside liquidity run would support the case for continuation. Failure there would suggest the earlier strength was more about stop collection than durable accumulation.
The context around the pullback matters. A dip into the zone while DXY stays soft is easier for bulls to defend. A drop into the same area while the dollar rebounds and yields keep rising is a weaker setup. Same price zone, different trade quality.
A controlled pullback into that zone is different from a momentum break through it.
A controlled pullback usually has overlap, smaller candles, and slower pace. That can create a cleaner mitigation setup. A momentum break is aggressive, wide-bodied, and usually leaves buyers with very little time to respond.
I would rather miss a marginal entry than buy into a falling knife dressed up as an imbalance. That is a strong opinion, and I stand by it. In gold, especially at this volatility, bad location gets punished fast.
When Does The Bullish Intraday Structure Fail?
If gold loses $4,620 with momentum, the bullish intraday structure becomes vulnerable.
If gold loses $4,620 with momentum, the bullish intraday structure becomes vulnerable. That level marks the lower edge of the first pullback area I’m watching. A clean break would show that buyers failed to defend the nearest logical mitigation zone.
Below $4,620, I would stop treating the session as a simple upside liquidity pursuit. The market may need a deeper repricing phase, especially after such a strong advance. That does not automatically create a bearish swing thesis, but it does weaken the intraday long argument.
Failure is more important if yields keep rising and the dollar stops weakening.
A break of $4,620 carries more weight when macro pressure aligns against gold. Rising yields already create friction. A dollar rebound would add another layer. Together, they would make it harder for buyers to justify paying higher prices after a failed liquidity run.
For more cross-market dollar context, I would pair gold levels with current DXY analysis. The dollar does not control every gold tick, but it often decides whether a marginal XAU/USD setup deserves capital or caution.
Below that threshold, traders should reassess whether the market is shifting from liquidity pursuit to deeper repricing.
Under $4,620, the question changes. Instead of asking whether gold can tag $4,700, traders should ask whether the upside liquidity has already been used. That is the shift from pursuit to repricing.
Oil and yields also belong in the background. WTI is near $86.64, slightly lower on the live board, but crude-linked inflation pressure can still affect rate expectations. For traders tracking that macro layer, WTI crude oil analysis around the $88 area is worth keeping on the radar.
My working read: gold stays constructive above $4,620, remains tactically drawn toward $4,680 to $4,700, and needs clean acceptance above $4,700 to convert the liquidity grab into a stronger continuation signal.
FAQ
What is the main takeaway from this gold SMC analysis?
Gold is showing notable relative strength at $4,661.60, up 2.0% intraday, because dollar weakness is offsetting pressure from the US 10-year yield at 4.736%. The smart money concepts focus is the nearby $4,680 to $4,700 buy-side liquidity pool and whether price displaces through it or sweeps and rejects.
How does DXY gold correlation affect XAU/USD today?
DXY is softer at 98.84, down 0.1%, which gives XAU/USD room to extend even with Treasury yields higher. In this setup, the dxy gold correlation favors gold because a weaker dollar reduces currency drag on the metal. A renewed dollar bid would lower the quality of a bullish continuation signal.
What would confirm continuation above $4,700?
Continuation needs a clean move through $4,700, preferably with strong candle expansion, solid body closes, and limited immediate rejection. Price acceptance above that liquidity area would shift attention from a simple raid to trend continuation, with the next pullback used to judge whether buyers defend the breakout.
Where should traders watch for a fair value gap pullback?
The first pullback zone to monitor is $4,620 to $4,640. I would not call it confirmed support in advance. It is an area for mitigation, fair value gap defense, or failed demand. Quick absorption supports continuation, while heavy selling pressure warns that the intraday bid is weakening.
When does the bullish gold setup become vulnerable?
The bullish intraday structure becomes vulnerable if gold loses $4,620 with momentum while yields continue rising. That would suggest the market failed to defend the first downside mitigation area and may be shifting from buy-side liquidity pursuit toward deeper repricing.
Gold has the bid, the dollar is giving it room, and $4,700 is close enough to force a decision. The next useful clue is simple: does XAU/USD accept above the liquidity, or does the market use that level to trap late buyers?
Disclaimer: This analysis is for educational purposes only and is not financial advice. Trading leveraged markets involves risk, and you should make decisions based on your own plan, risk tolerance, and independent research.