Gold is trading at $4,477.20, down 1.4%, and the tape has the look of a market being repriced by rates rather than randomly sold. My gold price analysis for this session is simple: XAU/USD is pressing toward the $4,450 liquidity shelf while the US 10-year yield sits at 4.784%, DXY firms to 99.16, and equities lean risk-off.
Gold Price Analysis Snapshot
XAU/USD trades at $4,477.20, down 1.4% on the session
XAU/USD is the standout mover in the live snapshot, with gold down 1.4% at $4,477.20. That drop matters because it is happening close to a known liquidity zone rather than in open space. When price sells into a shelf like $4,450, I care less about the size of the red candle and more about what happens when stops and resting orders get tested.
The decline also lands near a psychologically loaded area. Gold has been trading around the $4,450 to $4,500 band, and traders are now forced to decide whether this is a controlled pullback into liquidity or the start of broader acceptance lower. I covered the prior structure around this band in the $4,500 liquidity test, and that framework still matters because price has not moved far enough away to make the level irrelevant.
Gold is sliding toward, but has not yet reached, the $4,450 liquidity shelf
The key detail is that gold has not yet printed a retest of $4,450 in the live snapshot. At $4,477.20, price is close enough for traders to start positioning around it, but not close enough to call the level swept. That distinction matters. A market can look heavy into liquidity and still fail to complete the raid.
For me, $4,450 is the first meaningful downside marker. Above it, sellers have pressure but not full confirmation. Below it, the market begins answering a different question: are bids defending the shelf, or are they stepping away as yields and the dollar tighten the squeeze?
Equity weakness supports the broader risk-off tone
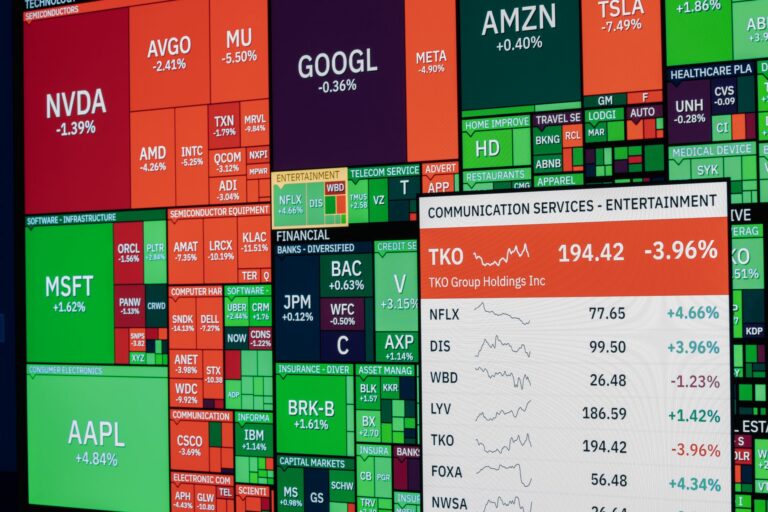
The equity board confirms the pressure is not isolated to metals. The S&P 500 is down 0.4% at 7,719, the Dow is lower by 0.5% at 53,414, and the Nasdaq Composite is off 0.3% at 26,507. VIX is also up 1.5% at 14.53, which fits the risk-off regime.
That matters because gold can behave differently across risk regimes. Sometimes it catches a safe-haven bid when stocks weaken. Other times, especially when the selloff is tied to rate repricing and a firmer dollar, gold trades like a duration-sensitive asset. That is the tape we have now. For broader cross-market context, I’d compare this move with the pressure discussed in the Nasdaq risk-off pullback, because tech, yields, and dollar strength are pulling on the same macro thread.
Why Is XAU/USD Sliding Today?
Renewed Fed-hike repricing lifts rate-risk expectations after hawkish Warsh remarks
The immediate macro driver is renewed Fed rate hike repricing. Recent commentary around hawkish Warsh remarks has revived the market’s sensitivity to higher-for-longer policy risk, and that has spilled into gold. Kitco’s market report framed the move around Warsh repricing and rate-risk pressure, which is consistent with what the live board is showing now.
Gold does not need an actual hike today to sell off. Repricing is enough. When traders mark up the probability of tighter policy, the front end and long end of the rates curve can pressure non-yielding assets before any central bank decision lands. That is why this move feels more macro-led than technical-only.
The selloff aligns with macro pressure rather than an isolated metals move
WTI crude is barely lower at $91.22, Bitcoin is slightly higher near $79,932, and Ethereum is up 1.7% at $2,500. This is not a clean “everything is crashing” tape. Gold weakness stands out because rates and the dollar are doing the heavy lifting.
That is my clear opinion: I would not treat this gold selloff as a simple bearish breakout unless the $4,450 shelf gets accepted below. A push into liquidity is one thing. Sustained trading under the shelf, with yields firm and DXY bid, is a different market condition.
Gold weakness is reinforced by higher Treasury yields, firmer DXY, and softer equities
The pressure stack is straightforward: higher Treasury yields, firmer DXY, softer equities. Only one of those would be manageable for gold. Together, they create a cleaner macro repricing setup. In my experience watching XAU/USD around rate-sensitive sessions, the nastiest gold moves often happen when the dollar and yields move in the same direction while risk sentiment weakens.
The equity weakness adds background stress, but it is not enough by itself to lift gold. Traders are prioritizing rate risk over safe-haven demand. That can change quickly, but the current live snapshot still favors sellers until XAU/USD proves it can recover the $4,480 to $4,500 area.
How Do 4.784% Yields And DXY 99.16 Pressure Gold?
US 10-year Treasury yield at 4.784% raises the opportunity cost of holding non-yielding gold
The US 10-year Treasury yield is at 4.784%, up 0.5% on the session. That is the cleanest explanation for why gold is under pressure. Gold does not pay interest. Treasuries do. When yields rise, especially alongside Fed rate hike risk, the relative appeal of holding bullion gets challenged.
This does not mean gold must fall every time yields rise. Correlations breathe. But when the yield move is tied to policy repricing, XAU/USD tends to respond more directly because real-rate expectations sit at the center of the trade. Traders don’t need to overcomplicate it.
DXY at 99.16 tightens the DXY gold correlation and pressures dollar-priced XAU/USD
DXY is trading at 99.16, up 0.3%, and that adds another layer of pressure. A stronger dollar makes dollar-priced gold more expensive for non-dollar buyers, and it also tends to pull capital toward cash when macro uncertainty is rising. The dxy gold correlation is rarely perfect tick for tick, but it matters when the dollar is firm at the same time yields are climbing.
Technical desks have been watching the dollar, gold, Bitcoin, and equities together, including in FOREX.com’s weekly technical outlook. That cross-asset lens is useful here. Gold is not trading in a vacuum. The dollar bid is shaping the XAU/USD forecast as much as the chart structure is.
Higher yields plus a stronger dollar make the decline a macro-driven repricing setup
When yields and DXY rise together, I classify the move as macro-driven unless the chart clearly says otherwise. Current price action supports that view. Gold is dropping toward liquidity, equities are soft, VIX is higher, and the dollar is firm.
My read: the $4,450 shelf is the line between a controlled liquidity test and a more serious downside acceptance phase.
That does not mean sellers automatically win below the level. It means the next reaction carries more information than the current candle. A fast stop-run through $4,450 followed by a recapture would tell a very different story than a slow grind under the shelf with no meaningful bid.
SMC Map: $4,450 Liquidity Shelf
The $4,450 zone is the immediate sell-side liquidity shelf below current price
From a Smart Money Concepts perspective, $4,450 is the obvious sell-side liquidity pool. Prior lows, resting stops, breakout sell orders, and forced-risk reductions tend to cluster around these shelves. That is why price can accelerate into them even when the broader move is already extended.
For readers newer to this framework, the goal is not to predict that every pool gets taken. The goal is to mark where the market has an incentive to trade. I keep a similar process across FX, indices, metals, and crypto, and you can find more background in our SMC trading strategies section.
A sweep-and-reclaim would suggest liquidity was taken without sustained bearish acceptance
A clean raid below $4,450 followed by a reclaim back above the shelf would suggest sellers found liquidity but failed to hold control. That is often where late shorts get uncomfortable. They sell the break, price snaps back above the level, and their risk becomes obvious.
The reclaim would need to be more than a tiny wick. I want to see acceptance back above the level, preferably with a push toward $4,480. The stronger version would be a return into the $4,480 to $4,500 band with momentum, because that would place price back inside the prior breakdown area.
Acceptance below $4,450 shifts focus from a dip to continuation risk
Acceptance below $4,450 changes the tone. A brief wick is noise. Multiple candles holding below the shelf, especially while the 10-year yield stays near 4.784% and DXY remains bid around 99.16, would make the bearish case more credible.
That is where traders need to avoid romanticizing support. Liquidity shelves can produce sharp reversals, but they can also become fuel for continuation when macro pressure is strong. The level matters because of the reaction around it, not because the number is magic.
Can Gold Reclaim $4,480-$4,500?
A reclaim above $4,480-$4,500 would signal sellers failed to hold the breakdown area
The $4,480 to $4,500 zone is the first upside test. Gold is currently below that band at $4,477.20, so buyers need to do work. A recovery through $4,480 would be the first clue that downside momentum is cooling. A stronger close back above $4,500 would put sellers under pressure.
That band has mattered before. The previous discussion around gold’s $4,450 break and risk-on behavior is useful because it shows how quickly the same level can flip from magnet to decision point. Markets recycle liquidity zones. They rarely respect them in a neat textbook way.
Short covering risk increases when price returns above that band with momentum
Short covering becomes more likely once price gets back above the zone that attracted breakdown sellers. Traders who sold weakness into $4,450 risk suddenly holding poor location. That is especially true when the move back through $4,500 is fast, because speed exposes trapped positioning.
I don’t chase the first green candle after a selloff. I’d rather see whether the market can hold above reclaimed structure. A push above $4,500 that immediately fades back under $4,480 would look like a failed recovery. Holding above the band would be a better sign that sellers lost control.
Failure to reclaim keeps pressure on the $4,450 liquidity shelf
Failure below $4,480 keeps the downside magnet active. The market would still be trading under the recovery band, still pressured by yields, and still vulnerable to another test of sell-side liquidity. That does not require panic. It only requires sellers to keep capping bounces.
The cleanest bearish behavior would be shallow rebounds, weak closes near lows, and continued firmness in DXY. Gold can stabilize without reclaiming $4,500, but stabilization is not the same as a bullish shift. The burden of proof sits with buyers right now.
XAU/USD Forecast Scenarios For The Next Session
Bearish scenario: gold accepts below $4,450 as yields and DXY remain firm
The bearish XAU/USD forecast centers on acceptance below $4,450. That would confirm that the liquidity shelf did not produce enough demand to absorb selling pressure. With the 10-year yield at 4.784% and DXY near 99.16, sellers would have a macro tailwind.
Under this scenario, traders would watch for lower-timeframe retests of $4,450 from below. A failed retest would strengthen the continuation case. The risk is a sharp reversal if the break is only a stop-run, so execution matters.
Neutral scenario: price chops between $4,450 and $4,500 while markets digest Fed rate hike risk
The neutral path is a range between $4,450 and $4,500. That would make sense if markets pause to digest Fed rate hike risk without getting a fresh push from yields or the dollar. Choppy trade inside that band would punish aggressive entries on both sides.
In that environment, I’d treat the edges as more important than the middle. Gold sitting at $4,470 or $4,475 tells me less than how it behaves near $4,450 or $4,500. The middle of a liquidity range is usually where conviction goes to die.
Bullish scenario: XAU/USD reclaims $4,500 and forces late sellers to cover
The bullish path needs a recapture of $4,500. That would show buyers absorbed the selloff and forced breakdown sellers to reassess. Confirmation improves if DXY cools from 99.16 and the 10-year yield stops pressing higher.
A reclaim would not erase the macro pressure immediately, but it would change the near-term tape. Gold would move from defending liquidity to pressuring shorts. For traders tracking broader opportunities across assets, the same cross-market discipline applies across more market analysis: respect the level, but trade the reaction.
FAQ
Why is gold falling today?
Gold is falling because Fed-hike repricing is lifting rate-risk expectations while the US 10-year yield trades near 4.784% and DXY firms around 99.16. Higher yields raise gold’s opportunity cost, and a stronger dollar makes XAU/USD less attractive to non-dollar buyers. Recent rate-risk commentary has also kept traders focused on policy sensitivity, with Kitco noting how Fed-hike trade expectations have shaped metals flows.
What is the key gold liquidity level now?
The immediate gold liquidity level is the $4,450 shelf, where prior sell-side liquidity sits below current price. Because gold is trading around $4,477.20, the level has not been retested yet. Traders are watching for either a stop-run and recovery above the shelf or acceptance below it.
How do Treasury yields affect XAU/USD?
Treasury yields affect XAU/USD by changing the relative appeal of non-yielding gold versus interest-bearing assets. When the 10-year yield rises, especially alongside Fed rate hike repricing, investors may reduce gold exposure because bonds and cash offer more compelling yield. The impact gets stronger when the dollar rises at the same time.
What would make the XAU/USD forecast turn bullish?
A near-term bullish shift would require XAU/USD to reclaim the $4,480 to $4,500 area after the selloff. That would suggest sellers failed to hold the breakdown, potentially forcing short covering. Confirmation improves if DXY cools and the 10-year yield stops pressing higher.
What happens if gold accepts below $4,450?
Acceptance below $4,450 would imply the decline is macro-driven rather than a random intraday dip. It would show sellers controlling the liquidity shelf as higher yields, firmer DXY, Fed rate hike risk, and broader risk-off equity weakness continue pressuring gold. The next session comes down to one question: does $4,450 get defended, or does it flip into resistance?
Disclaimer: This analysis is for educational purposes only and is not financial advice or a recommendation to buy or sell any instrument.