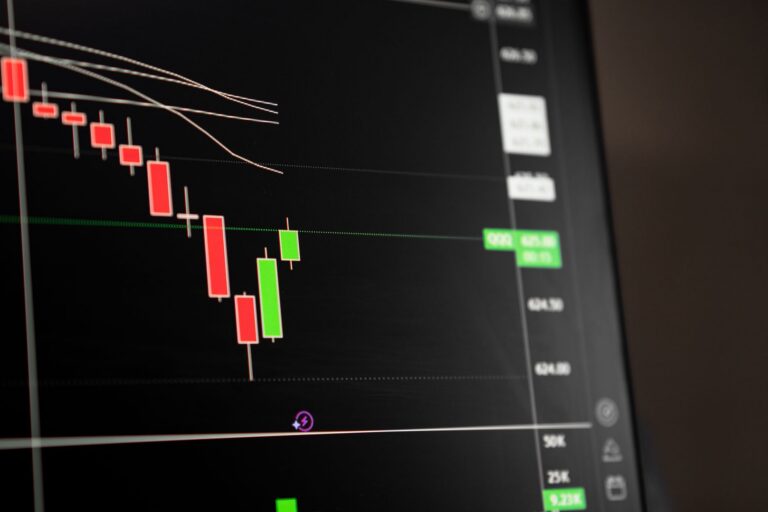
Gold is trading at $4,444.20, down 2.1% intraday, and the break under $4,450 is the first thing that matters on my screen. This gold price analysis is not about chasing a red candle after the fact. It is about reading why XAU/USD lost a visible support shelf while equities caught a bid, the dollar firmed, and Treasury yields stayed uncomfortable for non-yielding assets.
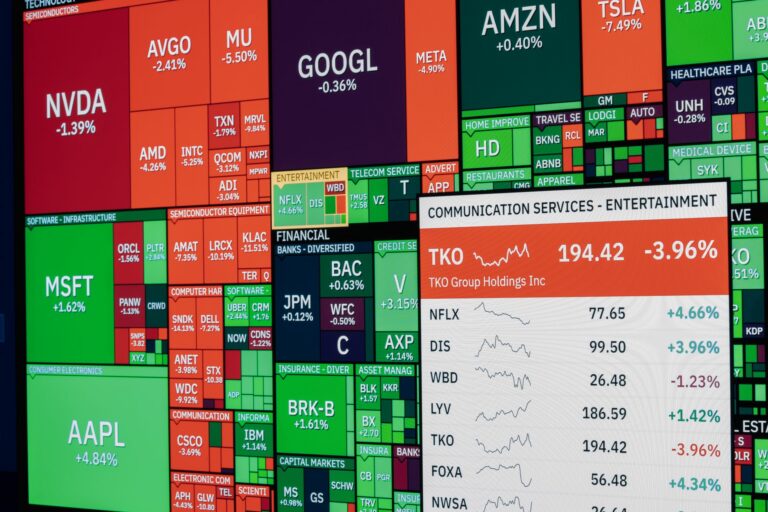
The tape is risk-on. The S&P 500 is up 1.1% at 7,748, the Nasdaq Composite is up 1.4% at 26,584, and the Dow is up 1.2% at 53,686. Bitcoin and Ethereum are also green. That matters because gold is not being sold in isolation. It is being repriced while capital rotates toward higher-beta assets and away from defensive exposure.
For broader context, I’m watching this alongside more market analysis across indices, FX, commodities, and crypto. Gold rarely gives its cleanest signal alone. The better read usually comes from the cross-market picture.
Why Did Gold Break Below $4,450 Today?
Gold trades at $4,444.20, down 2.1% intraday
At $4,444.20, gold is sitting below the $4,450 line that short-term traders were using as a nearby support reference. The intraday loss of 2.1% makes XAU/USD the strongest allowed mover of the session in this snapshot, which tells me the move deserves attention rather than casual dismissal.
The problem for bulls is not just the size of the drop. It is where the drop happened. $4,450 was close enough to spot to attract resting sell stops from late buyers, protective stops from intraday longs, and breakout traders trying to defend a continuation structure. Once that area failed, liquidity below it became the target.
The break under $4,450 looks like a stop-run through visible support
From a Smart Money Concepts perspective, the move below $4,450 signals that sell-side liquidity was taken. That does not automatically mean gold has started a major bearish trend. A liquidity raid can reverse quickly when the market grabs stops and immediately displaces back into the prior range.
But that is not what bulls have confirmed yet. Price is still below the broken level, and that keeps the burden of proof on buyers. A strong gold liquidity sweep would usually show aggressive rejection, fast expansion back above the level, and acceptance above the failed support. Until that happens, the break has to be respected.
I’ve seen this pattern plenty of times in metals and FX: the first break of a clean level gets traders emotional, but the second reaction around that same level tells you much more. My opinion is simple. The retest matters more than the first flush.
Intraday demand failed under broader macro pressure
The failed defense of intraday demand makes sense when the macro backdrop is stacked against gold. Risk appetite is firm, the dollar is stronger, and yields remain elevated. That is a tough combination for a non-yielding defensive asset.
There is also a positioning angle. When gold trades near a well-watched level like $4,450, short-term traders tend to cluster orders around it. Once price slices through, weak longs exit, momentum sellers press, and liquidity providers widen the path toward the next reaction zone. That is why I do not treat every support break as equal. Context decides whether the break is exhaustion or continuation.
How Are Risk-On Markets Pressuring XAU/USD?
Equities are bid across the board
The equity tape is doing real damage to gold’s safe-haven appeal. The S&P 500 is up 1.1% at 7,748, the Nasdaq is up 1.4% at 26,584, and the Dow is up 1.2% at 53,686. That is broad index strength, not a narrow pocket of speculation.
When stock indices rise together, portfolio managers and active traders usually have less reason to park capital in defensive hedges. Gold can still rally in risk-on conditions, especially when real yields fall or the dollar weakens, but today’s backdrop is different. The bid is going into equities while XAU/USD is breaking support.
For traders following tech and index flows, this is worth comparing with recent Nasdaq analysis near 26,400, because gold often reacts to the same rate and sentiment forces that move growth-heavy equity indices.
A soft VIX confirms fading defensive demand
The VIX is trading at 14.18, down 1.0%, which supports the risk-on read. A low and soft volatility index usually means investors are not aggressively paying for protection. That does not remove all downside risk from equities, but it does tell us the market is not acting scared right now.
Gold tends to benefit when fear rises, liquidity tightens, or investors seek protection from disorderly markets. Today, the opposite signal is showing. Risk on markets are being rewarded, volatility is calm, and gold is losing a support level instead of absorbing pressure.
Capital is rotating toward higher-beta assets
Bitcoin is up 0.9% at $79,405 and Ethereum is up 1.1% at $2,450. That crypto strength fits the same broad theme. Capital is leaning into beta. Equities are higher, crypto is higher, and defensive gold is lower.
That rotation does not need to be permanent to matter for XAU/USD today. Intraday gold traders care about marginal flows. When the marginal buyer prefers equities, crypto, or yield-bearing instruments, gold has to work harder to hold support. Right now, it failed that test around $4,450.
DXY Strength and Treasury Yields Keep Real-Rate Pressure High
The US Dollar Index is firm at 99.21
DXY strength is another direct headwind for XAU/USD. The US Dollar Index is trading at 99.21, up 0.3%, and that matters because gold is priced in dollars. A stronger dollar raises the effective cost of gold for foreign-currency buyers and often pressures commodity pricing more broadly.
EUR/USD is down 0.2% at 1.1600 and GBP/USD is down 0.2% at 1.3499, which confirms that the dollar bid is showing up across major FX pairs. USD/JPY is nearly flat at 155.76, but the broader dollar tone is still firm enough to weigh on metals.
Macro desks were already focused on the early September market setup in reports such as Newsquawk’s European opening news and Morning Bid Americas. I would not overstate any single headline from those updates, but the broader point is clear: traders are still pricing gold through the dollar, rates, and risk appetite channel.
The 10-year yield remains elevated near 4.786
Treasury yields are the bigger structural issue. The US 10-year yield is at 4.786, up 0.5% on the snapshot. That keeps real-rate pressure high and raises the opportunity cost of holding gold.
Gold does not pay interest. That is fine when investors are buying protection or when real yields are falling. It becomes a problem when government bonds offer attractive nominal yield and risk assets are also rising. In that environment, gold has to rely on momentum, inflation hedging, or fear. Today, none of those are doing enough to defend $4,450.
Dollar strength plus high yields is a tough mix for gold
When dollar strength and high yields align, non-yielding assets like gold often struggle to sustain bullish momentum. That is exactly the setup facing XAU/USD now. The dollar is firmer, the 10-year yield is elevated, and equity indices are taking capital.
This is why I do not isolate gold candles from macro conditions. Price action is the execution layer, but macro explains why certain levels fail with force. Traders who focus only on the $4,450 break without tracking DXY and yields are missing half the story.
Was This a Gold Liquidity Sweep or a Trend Shift?
The move below $4,450 cleared sell-side liquidity
From an SMC lens, the move below $4,450 represents a sell-side liquidity sweep through a visible support area. That support was obvious enough to attract attention, and obvious levels are rarely clean. They tend to become liquidity pools.
For readers working on structure-based execution, I would pair this market with SMC trading strategies, because the difference between a raid and a genuine break is one of the most important distinctions in discretionary trading.
A true downside continuation should hold below broken structure and produce lower-timeframe supply reactions on retests. A failed breakdown should recover the level quickly and punish late shorts. That is the decision point now.
$4,450 becomes the mitigation level
The key test is whether price reclaims $4,450 as a mitigation level or rejects from it as supply. While XAU/USD trades below that area, I treat it as broken support. A bounce into it is not automatically bullish. It may simply be a retest of supply created by the breakdown.
There is a clean logic here. Sellers who missed the first move may wait for price to return toward the breakdown area. Trapped longs may use the bounce to exit. Fresh shorts may look for rejection candles or lower-timeframe displacement. That combination can turn former demand into active supply.
Broken structure keeps continuation risk alive
A failure to reclaim broken structure keeps bearish continuation risk elevated. That does not mean gold must collapse from here. It means the highest-quality long setups need more proof than a small reaction bounce.
The bullish case needs a strong recovery through $4,450, acceptance above it, and weakening pressure from DXY, Treasury yields, and equities. Without those ingredients, the cleaner read is that gold has lost a near-term shelf and is vulnerable to another push lower after retesting supply.
Key XAU/USD Levels to Watch After the $4,450 Break
$4,450 is the main reaction zone
The broken $4,450 zone is now the primary reference level for reaction, mitigation, or rejection. I am watching how XAU/USD behaves around that level far more than I am watching random candle color.
A fast recapture of $4,450 with strong follow-through would challenge the bearish read. A weak bounce that stalls below or just around the level would support the idea that sellers remain in control. The best information usually comes from the reaction after the level is revisited, not from the initial break itself.
For context, gold recently tested nearby higher liquidity in our prior $4,500 liquidity test analysis. That matters because markets often move from one liquidity pocket to the next before establishing direction.
Bulls need displacement back above broken structure
A bullish reversal needs displacement back above broken structure and acceptance above the reclaimed zone. A small wick through $4,450 is not enough. I want to see buyers hold the area after reclaiming it, especially while the dollar and yields remain firm.
Acceptance matters because stop-runs can happen in both directions. Gold can sweep below support, bounce, and still fail if buyers cannot build value above the level. The stronger bullish signal would be sustained trade above $4,450, followed by shallow pullbacks that hold above the recaptured zone.
Rejection below $4,450 keeps supply in control
Below $4,450, the cleanest bearish setup remains a retest into nearby supply. That setup does not require guessing the low. It requires patience for price to return into a decision area, then proof that sellers are defending it.
WTI crude is also lower at $90.42, down 1.0%, which adds a small commodity-wide caution flag, though gold’s real drivers today are clearly risk appetite, DXY, and yields. I would not force a direct crude-gold correlation here. The better read is that defensive demand is fading while macro pressure stays heavy.
Trading Plan: Confirmation Before Chasing Gold Lower
Do not chase the liquidity break blindly
Avoid chasing the liquidity break without confirmation from structure, volume, and reaction around $4,450. The first flush through a level often looks obvious after it happens. That is exactly why late entries can be poor.
My plan is to let the market show whether the $4,450 break is accepted. Acceptance below the level, followed by a controlled retest and rejection, gives bears a cleaner structure. A violent recovery back above it makes late shorts vulnerable.
My bias is bearish while XAU/USD remains below $4,450, but I do not want to sell into exhaustion. I want the retest, the rejection, and the expansion away from supply.
Bearish continuation favors a supply retest
Bearish continuation favors a retest into supply followed by rejection and renewed downside displacement. That is the setup with the cleaner logic because it aligns broken structure, risk-on equity flows, DXY strength, and elevated Treasury yields.
The exact trigger should come from the trader’s timeframe. A scalper may use lower-timeframe structure. A swing trader may wait for a larger candle close and a broader failed recovery. Either way, the idea is the same: let price come to the area where sellers should defend, then judge the reaction.
Bullish risk rises only after a reclaim
Bullish risk increases only when XAU/USD reclaims the broken level while DXY, yields, and equities stop pressuring gold. A reclaim without macro relief can still work, but it is lower quality. A reclaim with dollar softness and falling yields is much more convincing.
That is why I am tracking the S&P 500, Nasdaq, DXY, and the 10-year yield alongside gold. The chart gives the level. The cross-market tape gives the pressure. Together, they decide whether $4,450 becomes a bear trap or a supply shelf.
For traders who want to compare this with other commodity setups, the recent WTI crude oil pullback analysis is useful because it shows how quickly commodity narratives can change when macro flow shifts.
FAQ
Why did gold fall below $4,450?
Gold fell below $4,450 because risk appetite improved, the dollar firmed, and elevated Treasury yields kept pressure on a non-yielding asset. With the S&P 500, Nasdaq, and Dow all higher and VIX lower, defensive demand faded while XAU/USD failed to hold intraday demand.
Is $4,450 still support for gold?
$4,450 is no longer clean support while price trades below it. In SMC terms, the level becomes a mitigation or supply zone to monitor. A reclaim with displacement would improve bullish odds; a rejection there would favor bearish continuation from the broken structure.
How does DXY strength affect XAU/USD?
A firmer US Dollar Index pressures XAU/USD because gold is priced in dollars. With DXY at 99.21 and up 0.3%, foreign-currency buyers face a higher effective cost, and momentum traders often reduce gold exposure when dollar strength aligns with higher yields.
Why do Treasury yields matter for gold price analysis?
Gold does not pay income, so elevated Treasury yields raise the opportunity cost of holding it. The 10-year yield near 4.786 keeps real-rate pressure high, especially when inflation expectations are stable and investors can rotate toward risk assets or interest-bearing alternatives.
What confirms a bullish reversal in gold?
A bullish reversal needs more than a small bounce. Traders should look for displacement back above the broken $4,450 structure, acceptance above that zone, and failed follow-through from sellers. Without that, the cleaner SMC setup remains a bearish retest into supply.
Gold has given traders a clean line in the sand. Below $4,450, sellers have the edge, but the next reaction into that level will tell us whether this was only a liquidity grab or the start of a broader downside leg. What are you watching first, the reclaim or the rejection?
Disclaimer: This analysis is for educational purposes only and is not financial advice. Trading involves risk, and you should make decisions based on your own plan, risk tolerance, and independent research.