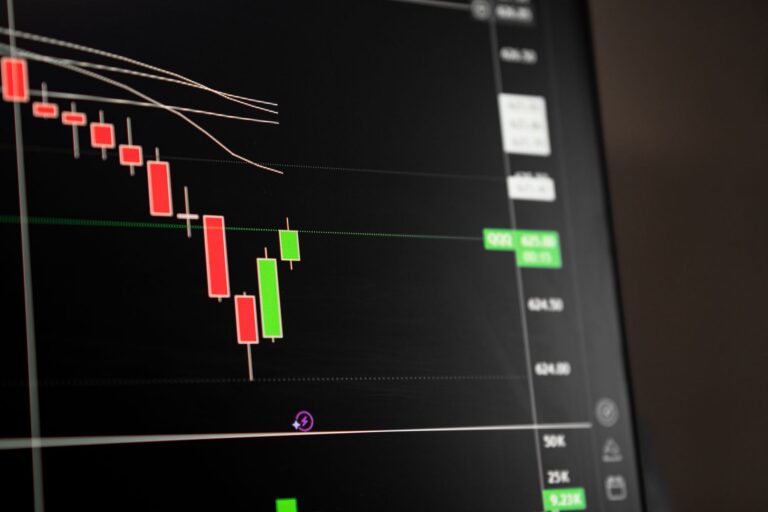
ETH is trading near $1,897, up 1.0% over 24 hours, while Bitcoin is near $63,510, up 0.9%. That small outperformance matters. This ethereum smc analysis reads the move as a liquidity test, not confirmation that crypto has flipped into a clean risk-on expansion. VIX is higher, the US 10-year yield is sitting at 4.710%, and equities are soft. ETH has a bid, but the tape is asking traders to be selective.
My view is simple: Ethereum can continue higher from here, but the better trade is rarely the emotional chase into the first stop-run. I want acceptance, displacement, and structure. Without those, a strong candle near $1,897 can still become a raid into resting buy stops.
Ethereum SMC Analysis Thesis: Relative Strength, Not Risk-On
ETH near $1,897 is the strongest allowed mover after rotation filters
Ethereum is the strongest mover in the crypto pair shown in the snapshot, trading around $1,897 and gaining 1.0% over 24 hours. That qualifies as relative strength, especially because it is outperforming Bitcoin by a small margin. It does not, by itself, qualify as broad market confirmation.
That distinction matters for Smart Money Concepts traders. A relative strength move can attract aggressive breakout buyers, but it can also invite a clean sweep into nearby buy-side liquidity before price rotates lower. The difference is in how ETH behaves after taking liquidity. Does it expand and hold above the range, or does it immediately sink back into the same consolidation?
For traders building a broader crypto read, I would pair this ETH tape with more crypto analysis rather than treating one 24-hour move as a stand-alone signal. The market is fragmented right now. ETH is firm, but the cross-asset background is not offering full support.
Bitcoin is firmer at $63,510, but ETH is slightly outperforming on the session
Bitcoin trading near $63,510 with a 0.9% gain gives the market a decent base. The issue is that BTC is not exploding higher. It is firm enough to keep ETH supported, but not strong enough to confirm a broad speculative bid across crypto.
That is why the ETH/BTC relationship deserves attention. When ETH leads while Bitcoin is only modestly higher, I read it as rotation rather than full-market expansion. Rotation can be tradable. It can also be thin. Thin rotation often produces sharp intraday movements that look convincing at first and then fade once stops are cleared.
The setup favors measured SMC execution over chasing a headline-driven push
The current Ethereum price action favors patience. I want the market to show whether the push above nearby highs is being accepted or merely used to engineer liquidity. In practice, that means watching the first reaction after any stop-run above the local range.
After years of watching crypto around macro inflection points, I have learned that the first clean-looking breakout is often the least efficient entry. The market tends to reveal its intent on the retest, not on the headline candle. That is where execution quality improves.
Traders looking to refine that process can compare this setup with broader SMC trading strategies, especially the relationship between liquidity grabs, imbalance mitigation, and structural confirmation.
Why Is ETH Strength A Liquidity Test, Not A Chase?
VIX is up 5.8% to 15.08, keeping the broader tape in a risk-off crypto regime
The CBOE Volatility Index is up 5.8% at 15.08. That is not panic territory, but direction matters. Rising volatility changes how I treat crypto breakouts. It makes me less willing to pay up for the first push and more focused on whether price can hold after liquidity is taken.
Equity volatility rising while ETH pushes higher creates a tension. The crypto chart can look constructive, but the macro tape is less supportive. In a risk-off crypto regime, even quality setups need stricter confirmation because liquidity can disappear quickly when volatility expands.
External market commentary has also kept rates and risk appetite in focus, with FXCM discussing how rates, risk, and breakouts are shaping market direction. That theme fits the current ETH setup. Breakouts are being tested by the macro backdrop, not handed clean follow-through.
US 10Y Treasury yield at 4.710% limits the quality of duration-sensitive crypto breakouts
The US 10-year Treasury yield at 4.710% is a problem for aggressive crypto bulls. Ethereum is not a bond, but crypto trades like a long-duration risk asset when liquidity conditions tighten. Higher yields raise the hurdle rate for speculative assets and reduce the quality of momentum chasing.
That does not mean ETH must fall. It means the burden of proof is higher. A breakout near $1,897 needs to do more than print a green candle. It needs to reclaim a range, build acceptance, and avoid an immediate return into the prior dealing area.
My opinion: with yields this elevated, traders should demand cleaner confirmation than they would in a true liquidity expansion. The market can still reward longs, but sloppy entries get punished faster.
ETH strength should be treated as relative strength until liquidity acceptance confirms continuation
Relative strength is useful, but it is not a trade plan. ETH outperforming BTC by 0.1 percentage point over 24 hours tells us capital is favoring Ethereum slightly. It does not tell us whether the next move is continuation or a liquidity raid.
The key is acceptance. A move above short-term highs that holds, consolidates, and creates fresh imbalance is different from a wick that taps stops and rejects. One shows demand staying in control after the raid. The other shows liquidity was the destination.
Where Are The Key ETH Liquidity Levels?
Short-term buy-side liquidity sits above the current range and is the first area to monitor
With ETH near $1,897, the first working buy-side liquidity zone sits just above the current local range. I would be watching the area above roughly $1,910 to $1,935 as the immediate stop pool, depending on the intraday chart feed and session high. That zone is close enough to current price to matter, and close enough to be raided without proving a larger trend shift.
Above that, a firmer acceptance zone would start to form only after price spends time above the range and refuses to re-enter. A fast wick through those highs is not enough. The market needs to show that buyers are willing to transact above prior resistance rather than simply using that level for exit liquidity.
A sweep and rejection above the range would warn that upside liquidity was raided, not accepted
A sweep above the current range followed by a sharp return below $1,897 would be a warning. That kind of move tells me the market reached for buy stops, filled orders, and failed to hold the premium area. It is especially important in a risk-off crypto backdrop because failed upside raids can rotate quickly toward sell-side pools.
The first downside areas I would monitor are the near-range lows around $1,875 to $1,865, then a deeper pocket near $1,840 if pressure expands. Those are not price targets to blindly short into. They are liquidity pools where reaction matters.
For context on prior ETH liquidity behavior, the older breakdown in Ethereum Price Analysis: ETH Eyes $1,600 Liquidity is useful because it shows how Ethereum can travel from one pool to the next once structure fails. The levels are different now, but the logic is the same.
Acceptance above the range would shift focus toward continuation and higher-timeframe liquidity pools
Acceptance above the local range would change the read. A sustained hold above roughly $1,910 to $1,935 would point toward continuation, with traders then watching the next clusters above spot rather than fading every push. The important part is the hold.
Clean acceptance usually shows up as tight consolidation above the reclaimed zone, shallow pullbacks, and fresh expansion away from the level. That combination tells me the market is no longer treating the high as a stop-run destination. It is treating it as support for the next auction.
How Should Traders Read The Fair Value Gap Near $1,897?
A nearby bullish fair value gap around the current $1,897 area is more actionable than chasing strength
The fair value gap near the current $1,897 area is the more useful part of the setup. I would rather see ETH pull back into a nearby bullish imbalance, react, and hold structure than chase a candle into the highs. That gives traders a defined area to judge order flow.
For a working intraday map, the imbalance around roughly $1,885 to $1,905 is worth watching. The exact boundaries depend on the chart timeframe, but the concept is clear. A partial mitigation that holds above local lows keeps the bullish case alive. A full fill followed by weak bounce changes the tone.
Price needs to mitigate the imbalance and hold structure before long continuation makes sense
A high-quality mitigation should not look labored. ETH can trade into the imbalance, slow down, and then show displacement back toward the highs. That response tells me buyers are defending the inefficiency rather than letting price drift through it.
Good SMC execution is less about predicting the exact tick and more about judging the reaction. The market gives clues through candle bodies, time spent at the level, and whether opposing liquidity is attacked immediately after the fill.
For a recent comparison of ETH acting stronger during a rebound phase, see Ethereum Price Analysis: ETH Leads Risk Rebound. The current tape is less clean because volatility and yields are leaning against the move, but the rotation concept still matters.
Failure to respect the imbalance would increase the odds of a lower-liquidity sweep
A failure through the imbalance near $1,897 would put the lower pools back in focus. I would watch how ETH behaves around $1,875 to $1,865 first. A clean break below that shelf could attract a stop-run toward the deeper $1,840 area.
That is where many traders make the mistake of assuming every dip into a gap is a buy. It is not. A fair value gap is useful only when price respects it. Once the market trades through the imbalance and cannot reclaim it, the same zone can flip into resistance.
What Confirms A Market Structure Shift For ETH?
A clean market structure shift requires displacement above local highs, not just a brief liquidity wick
A market structure shift requires more than a poke above resistance. I want displacement through local highs with bodies closing above the range, followed by a pullback that respects the reclaimed area. A wick alone is weak evidence.
For ETH near $1,897, that means a move above the local highs around $1,910 to $1,935 should create distance. The market should not instantly collapse back to the midpoint. Expansion away from the range tells me new buyers are participating, not only trapped breakout traders.
Follow-through should hold above the reclaimed range rather than immediately reject back inside it
The retest is the cleaner read. When ETH recaptures a range and then holds above it, the structure improves. When it rejects back inside, the bullish case becomes fragile.
This is where volume and reaction speed matter. A slow bleed back into the range after a stop-run usually means the auction failed. A quick test, firm defense, and renewed bid suggests the market is building a base for continuation.
Strong confirmation pairs acceptance with volume, imbalance creation, and no fast reversal into prior liquidity
The best confirmation combines acceptance, volume, and a fresh imbalance. That is the only rule-of-three I care about in this setup. ETH needs to prove that demand remains active after taking buy-side liquidity.
A valid continuation leg would leave behind a new imbalance above the reclaimed zone and avoid a fast reversal into the prior liquidity pocket. That is when a long setup becomes more than a hopeful breakout entry. Until then, the market is still testing whether buyers can absorb supply.
Risk-Off Crypto Dashboard: VIX, Yields, DXY, And Equities
S&P 500 is down 0.2% at 7,786 and Nasdaq is down 0.3% at 26,729, showing crypto is diverging from equities
The S&P 500 is trading around 7,786, down 0.2%, while the Nasdaq Composite is near 26,729, down 0.3%. The Dow is also softer at 53,732, down 0.2%. Crypto is diverging from equities, with ETH and BTC both higher on the session.
That divergence is interesting, but I would not overstate it. A small crypto rally against weak equities can continue for a while, especially when the dollar is softer. Yet equity weakness still lowers the quality of risk appetite. When stocks are heavy and volatility is rising, crypto longs need tighter invalidation.
Broader market live coverage, including the kind of index-level moves highlighted in TS2’s stock market updates, reinforces why cross-asset confirmation matters. ETH can lead, but it still trades inside a global risk framework.
DXY is down 0.2% at 99.42, giving ETH breathing room without proving broad risk appetite
The US Dollar Index is down 0.2% at 99.42. That helps ETH because a softer dollar often reduces pressure on risk assets. EUR/USD at 1.1597 and GBP/USD at 1.3558 are both up 0.2%, which confirms mild dollar softness across major FX pairs.
Still, DXY weakness alone does not erase the higher VIX or the 4.710% Treasury yield. The dollar is giving Ethereum some room to work, but it is not delivering a full green light. I would treat that as a supportive input, not a decisive signal.
Ethereum price action remains constructive only while it absorbs liquidity despite higher volatility and elevated yields
Ethereum price action is constructive as long as ETH keeps absorbing supply near $1,897 and does not lose the nearby imbalance. The test is simple in practice: can price hold the current area, take upside liquidity, and remain above the reclaimed range?
A constructive path would involve a controlled mitigation near the fair value gap, a push through local highs, and acceptance above the range. A weaker path would show a buy-side raid, fast rejection, and rotation toward $1,875 to $1,865. Both scenarios are live. The market has not chosen yet.
For traders who want to compare the current setup against a prior ETH risk-on framework, Ethereum Price Analysis: Risk-On Bid Near $1,925 is a useful reference. The difference now is that the macro background is less generous.
FAQ
What is the main takeaway from this ethereum smc analysis?
ETH is showing relative strength near $1,897, up 1.0% while Bitcoin is up 0.9%. But with VIX rising to 15.08 and the US 10-year yield at 4.710%, this is a liquidity test rather than proof that the broader crypto tape has turned risk-on for active traders.
Which ETH liquidity levels matter most right now?
The first focus is short-term buy-side liquidity above the current range, roughly around $1,910 to $1,935 on a working intraday map. A sweep and rejection would warn against chasing. Acceptance above that zone would make a cleaner market structure shift more credible.
How does a 4.710% Treasury yield affect Ethereum price action?
Higher yields pressure duration-sensitive assets by making speculative risk less attractive. For Ethereum price action, that can reduce breakout quality, especially when equities are soft. ETH may still rally, but SMC traders should demand stronger acceptance and cleaner follow-through.
What role does the fair value gap play in this setup?
A nearby bullish fair value gap around the current $1,897 area can provide a more objective reaction zone than a headline-driven entry. The key is whether price mitigates the imbalance, holds structure, and then regains momentum without immediately sweeping lower liquidity.
Is risk-off crypto still a concern if DXY is lower?
Yes. DXY at 99.42, down 0.2%, gives ETH some breathing room, but it has not translated into broad risk appetite. VIX is higher, yields remain elevated, and equities are soft, so the dollar tailwind should be treated cautiously by traders.
ETH has the relative strength. Now it needs to prove acceptance. I’ll be watching whether buyers can defend the $1,897 area and convert the next liquidity grab into real continuation. What level are you using as your ETH invalidation line?
Disclaimer: This analysis is for educational purposes only and is not financial advice. Trading crypto involves risk, and you are responsible for your own decisions.