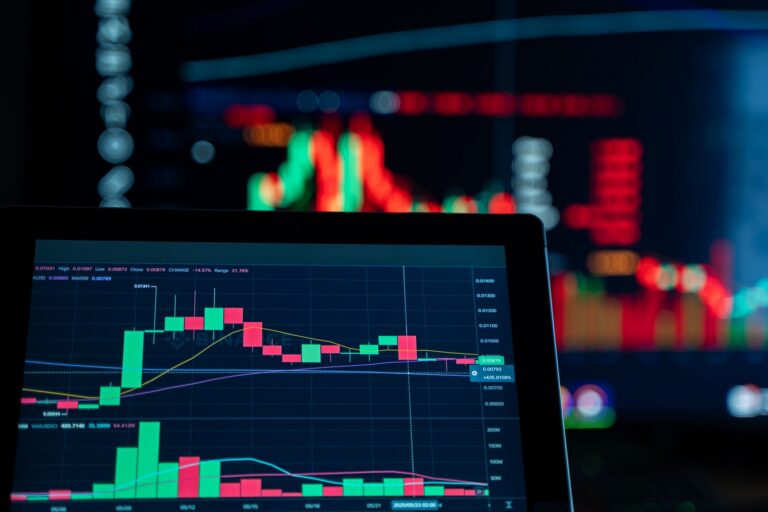
WTI crude oil is sitting at $99.54, down 2.9%, after rejecting the $100 handle that every discretionary trader, CTA model, and headline scanner had on the screen. That rejection matters because crude did not fail at a random number. It failed at the obvious pool of attention, right where late buyers tend to get pulled in and where Smart Money Concepts traders start asking whether the move was a breakout or a liquidity grab.
The tape is mixed across markets. Gold is barely lower at $4,404.60, the S&P 500 is down 0.6%, the Nasdaq Composite is off 0.7%, and the Dow is lower by 0.6%. The US 10Y yield is still heavy at 4.912%, while VIX has cooled to 15.89. That combination tells me crude is carrying its own macro weight here. The oil move is not isolated, but it is also not being fully confirmed by broad risk appetite.
WTI Crude Oil Snapshot: $99.54 After $100 Rejection
Live mover context: WTI down 2.9% yet still the strongest allowed non-crypto mover today
WTI is the standout non-crypto mover on the live board by percentage move, even though the direction is lower. That is important. A 2.9% slide in crude near a major psychological handle changes risk pricing across energy, inflation expectations, and equity sector rotation faster than a quiet drift in the dollar or gold.
Recent market recaps have flagged oil trading through or around the $100 area while US equities came under pressure, including coverage from TradingKey on WTI near $100 and falling US stocks. The key update now is that spot is no longer holding above the round number. It is back at $99.54, which puts the failed breakout narrative front and center.
For broader cross-market context, I’d compare this setup with more market analysis rather than reading crude in isolation. Oil is a macro asset. It can trade on inventory, geopolitics, positioning, dollar liquidity, and inflation expectations all in the same session.
Why the psychological $100 handle matters for intraday order flow
The $100 level is not magic. It is visible. That is the whole point.
Round numbers attract resting stops, breakout orders, option-related hedging flows, and media attention. When crude trades into $100, short sellers often have buy stops above it, momentum buyers have entry orders around it, and intraday traders start anchoring their risk to it. That creates a thick zone of liquidity rather than a single clean line.
In my experience, the first reaction around a major round number tells you less than the second reaction. The initial push can be emotion. The response after the stop-run shows whether larger traders are accepting price or using the liquidity to distribute. Right now, the failure to hold above $100 leans toward distribution until proven otherwise.
Immediate bias: sellers retain control while price holds below $100
My view is simple: sellers deserve the benefit of the doubt while WTI holds below $100. That does not mean crude must collapse. It means the cleanest intraday reference is the failed reclaim, not a fresh bullish continuation.
A move back above $100 without strong expansion would be vulnerable to another fade. A decisive push through $100 with wide candles, strong closes, and shallow pullbacks would change the tone. Until that arrives, the market has already shown rejection at the obvious buy-side pocket.
Why Did WTI Crude Oil Reject The $100 Handle?
Buy-side liquidity formed around the round number before rejection
The rejection is best understood as a liquidity event. Price stretched into the area where buy stops and breakout orders were likely resting. Once those orders were triggered, the market needed fresh continuation demand. It did not get enough.
That matters for oil price analysis because a failed push through a high-attention level often leaves trapped longs above or near the handle. Those traders become potential sellers on a retest. Their risk is obvious. Their pain point is obvious. The market likes obvious.
For SMC traders, the question is not whether $100 is “resistance” in the old textbook sense. The better question is whether the move above it delivered acceptance or only harvested liquidity. At $99.54, the evidence favors the second interpretation.
Failure above $100 gives SMC traders a clean bearish reference point
A clean reference point is valuable because it defines invalidation. The $100 region now acts as the line where bearish control is tested. Sellers want price to remain heavy below it. Bulls need to recapture it with force, not a slow grind that looks more like another setup for a raid.
Traders who use SMC trading strategies should focus on structure around the rejection: where the last impulsive selling leg began, whether a fair value gap remains unfilled, and whether the next bounce mitigates supply before turning lower. I do not like shorting into a vertical drop. I prefer the market to come back to my area, show hesitation, and then leave with intent.
Trading read: below $100, the failed breakout is the active reference. Above $100 with real expansion, the bearish idea needs to be reduced or abandoned.
Watch $99.50 as the nearby liquidity magnet, not confirmed support
Price is hovering close to $99.50, which makes that level relevant, but I would not call it confirmed support. It is too close to current spot and too obvious on the tape. Nearby half-dollar and round-dollar levels in crude often act like magnets first and decision points later.
A brief reaction from $99.50 would not impress me by itself. The better clue is how price behaves after taking liquidity around that area. A shallow bounce that stalls below $100 keeps the bearish structure intact. A fast rejection lower from $99.50 followed by a reclaim would show sellers losing control, but that is not the current base case.
How Do Demand Downgrades Change The Oil Price Analysis?
OPEC and IEA downgrades to 2026 oil demand growth weaken the bullish narrative
Demand matters because crude rallies need buyers who believe barrels will be needed at higher prices. Fresh references to OPEC and IEA downgrades to 2026 demand growth weaken the bullish narrative behind the $100 push. The market can absorb supply-risk headlines for a while, but demand revisions change the forward curve psychology.
Newsquawk’s Asia-Pac opening news highlighted the broader macro and commodity backdrop, including the type of headline flow traders are using to price crude near the $100 region. I treat those demand updates as a cap on enthusiasm rather than an immediate crash signal. A downgrade does not mean no one needs oil. It means the market has to be more careful paying up for future barrels.
Demand concern explains the fade despite geopolitical supply-risk headlines
The fade makes sense when demand and supply headlines are pulling in opposite directions. Red Sea risk keeps a premium in the market. Demand downgrades question whether that premium deserves to expand.
That is why crude can look bullish on geopolitics and still reject a breakout. Traders who only read the supply side get confused by this. The tape is telling us that the market is not willing to chase every risk headline at any price. At $99.54, crude is still elevated enough to keep inflation traders awake, but it has not earned a clean continuation above $100.
Oil demand forecast revisions can cap rallies unless price reclaims $100 with displacement
The oil demand forecast is now part of the technical setup. When forecast revisions turn softer, rallies into obvious liquidity become more vulnerable. The market needs stronger confirmation to justify continuation.
For me, the key would be a reclaim of $100 with strong candle bodies and acceptance above the handle. Weak wicks above the level are not enough. The market already showed that it can trade there and fail. Bulls now need a better quality move.
That is the difference between a headline spike and a tradable shift in order flow. One can happen fast. The other usually leaves evidence through structure, volume behavior, and the way pullbacks hold.
Red Sea Oil Risk Versus Weaker Saudi Export Headlines
Red Sea disruption keeps an upside risk premium in crude
Red Sea oil risk remains the main reason I would not get blindly bearish on crude. Shipping disruption, rerouting risk, insurance costs, and broader Middle East uncertainty can all support a premium even when demand data softens. Energy markets price uncertainty before the full impact shows up in barrels.
That upside risk is why the $100 area is still dangerous for both sides. Shorts who get too aggressive below the handle can be squeezed by one strong headline. Longs who chase above it can get trapped if the market treats the event risk as already priced.
Reports of weaker Saudi exports add supply-side tension
Weaker Saudi export headlines add another layer. Lower exports can look supportive because fewer barrels moving into the market can tighten perceived supply. But the interpretation is not always one-way. Export softness can reflect strategy, logistics, regional demand shifts, or weaker buying interest depending on context.
That is why I avoid turning a single export headline into a full commodity trading strategy. Headlines inform the bias. Price confirms whether the bias is tradable.
The conflict: supply risk supports price, but demand downgrades limit follow-through
The conflict is clean: supply risk supports price, demand downgrades limit follow-through. That leaves WTI stuck in a high-energy decision zone around $99.50 to $100.
Coverage from Saxo’s market quick take on oil above $100 and yields also points to the macro sensitivity around this level. Crude above $100 is not just an energy story for traders. It feeds directly into rates, inflation expectations, and equity valuation pressure.
Crude Oil Liquidity Map For SMC Traders
Upside liquidity zone: $100.00 to $102.50 if bulls force a sweep and displacement
The first upside liquidity zone sits from $100.00 to $102.50. That area contains the rejected handle, likely stop clusters above the failed high, and potential breakout liquidity from traders waiting for a second attempt.
If bulls force a sweep above $100 and then hold above the level with a strong expansion, the setup changes. The bearish rejection would become vulnerable to a trap reversal, with shorts below the handle providing fuel. The $102.50 area would then become the next reasonable upside liquidity pocket to monitor.
Until that happens, I treat $100 to $102.50 as a conditional upside target zone, not a forecast. There is a difference.
Bearish imbalance risk: $96.60 to $98.00 if sellers defend the rejection
The downside map opens toward roughly $96.60 to $98.00 if sellers keep defending the $100 rejection. That area is close enough to current price to be relevant, but far enough away to require confirmation rather than assumption.
The path lower would likely come through a failed bounce, a lower high below $100, and then a push through nearby liquidity around $99.50. A clean drive into $98.00 would tell me the market is repricing the failed breakout more aggressively. A move toward $96.60 would suggest the rejection created a larger imbalance than the first pullback revealed.
Commodity trading strategy: wait for sweep, displacement, and mitigation rather than chasing
The best commodity trading strategy here is patience. Chasing the first move after a $100 rejection is usually poor trade location. The smarter play is to wait for a raid, a strong directional response, and then a mitigation entry where risk can be defined.
- Bearish plan: price remains below $100, bounces into supply, stalls, then rotates lower toward $99.50 and potentially $98.00.
- Bullish plan: price reclaims $100 with authority, holds the level on retest, then targets the $100.00 to $102.50 liquidity band.
- No-trade condition: price chops between $99.50 and $100 without expansion, creating noise rather than structure.
I would rather miss the first leg than enter in the middle of a messy $0.50 range. Crude punishes impatience, especially near psychological levels where everyone thinks they see the same trade.
What Does Oil Strength Mean For Equities And Rates?
S&P 500, Nasdaq, and Dow weakness suggests oil is trading like an inflation tax
The equity tape is soft. The S&P 500 at 7,592, Nasdaq Composite at 26,082, and Dow at 52,064 are all lower by 0.6% to 0.7%. That matters because oil strength near $100 can act like an inflation tax on consumers and margins. Even with WTI currently back under the handle, the market has already been forced to price the risk of expensive energy.
For equity traders, this setup connects well with recent Nasdaq risk-off analysis. Higher oil can pressure growth multiples through inflation fears and higher discount-rate expectations. The relationship is not mechanical every session, but the direction of travel matters when crude is making the loudest move on the board.
US 10Y yield near 4.912% keeps macro pressure on risk assets
The US 10Y yield near 4.912% is still a major macro input. Even though it is down 0.6% on the session, the absolute level remains restrictive. Risk assets do not get much relief when yields are still sitting near 5% and oil is flirting with $100.
The US Dollar Index at 99.04 is flat, EUR/USD is slightly lower at 1.1601, GBP/USD is slightly higher at 1.3521, and USD/JPY is down 0.6% at 153.44. FX is not screaming one clean macro message. That puts even more weight on crude’s own structure.
Traders following the rates and currency angle can also compare the move with USD/JPY analysis as yen demand fights yields. Oil, yields, and the yen often become part of the same risk conversation when inflation anxiety rises.
Oil above $100 would keep Fed inflation concerns alive
An accepted move above $100 would keep Fed inflation concerns alive because energy feeds headline inflation expectations quickly. Policymakers can look through some oil volatility, but markets rarely ignore a sustained break above a major level.
That is why the current rejection is so important. Below $100, the market can argue that supply risk is being contained by weaker demand expectations. Above $100 with acceptance, that argument gets harder to defend. The next clean move around the handle will probably matter more than the first headline that caused the test.
FAQ
Why is WTI crude oil fading after trading near $100?
WTI crude oil is fading because the $100 handle attracted liquidity and then rejected, while fresh OPEC and IEA demand downgrades weakened the bullish case. Red Sea risk still supports an upside premium, but weaker demand expectations are currently limiting follow-through above the round number.
What is the key level for WTI crude oil today?
The key live level is the $100 handle, with price trading around $99.54 after rejection. For SMC traders, a sustained hold below $100 favors sellers, while a sweep back above $100 followed by displacement would warn of a bullish trap reversal.
How does Red Sea oil risk affect this oil price analysis?
Red Sea oil risk supports crude by increasing concern over shipping disruption and supply uncertainty. However, the market is not treating that risk as fully bullish today because demand downgrades are offsetting the supply narrative, keeping WTI crude oil below the rejected $100 reference.
Where is crude oil liquidity likely resting now?
Nearby crude oil liquidity is concentrated around $99.50 and the rejected $100 handle. Above that, the main upside liquidity zone sits around $100.00 to $102.50. If sellers defend the rejection, downside imbalance risk opens toward roughly $96.60 to $98.00.
What commodity trading strategy fits this WTI setup?
A disciplined commodity trading strategy is to avoid chasing the first move and wait for confirmation. Below $100, sellers have the cleaner structure. A sweep above $100 with strong displacement could flip the setup, but without that, the rejection remains the dominant intraday reference.
The forward read is straightforward: $100 is the battlefield, $99.50 is the nearby magnet, and the next quality move should tell us whether crude is building for another raid higher or starting a deeper repricing toward the high $90s. Which side of the $100 level are you trusting next?
Disclaimer: This analysis is for educational purposes only and is not financial advice. Trading commodities involves risk, and you should make decisions based on your own plan, risk tolerance, and research.