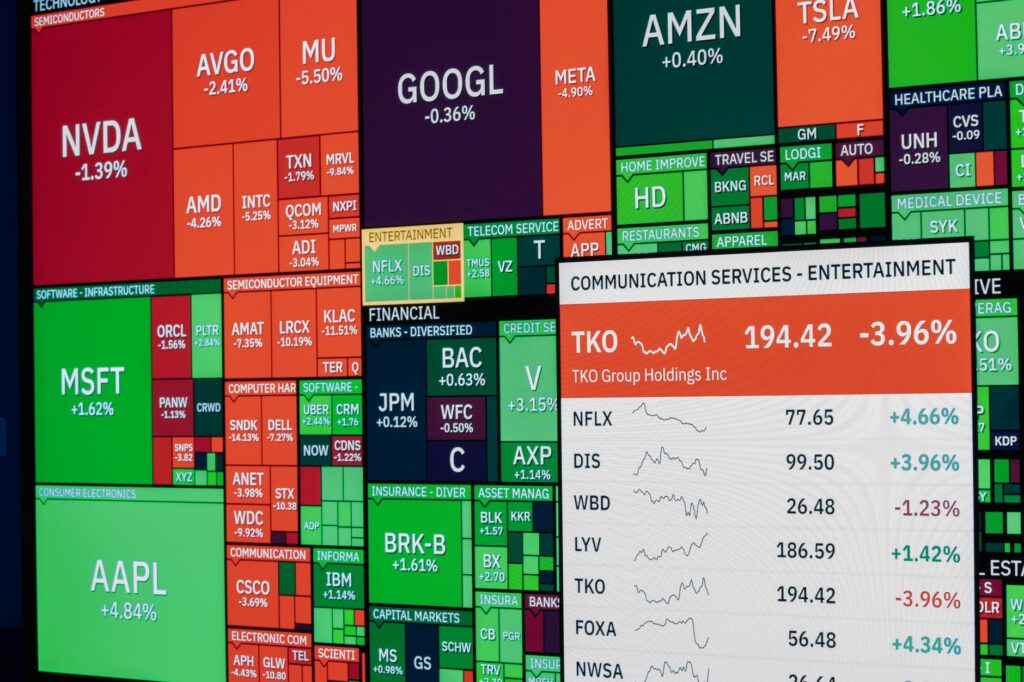
The Dow is trading at 51,462, down 1.2% intraday, and the tape is pressing directly into the 51,400 to 51,500 liquidity pocket. That makes this dow jones analysis very simple at the top level: price is already inside the danger zone, sellers have momentum, and any reaction from here needs confirmation rather than blind bottom-picking.
I’m treating 51,500 as active stock market liquidity under pressure, not clean support. There’s a big difference. Support implies buyers have already proven control. Liquidity under pressure means resting stops, late longs, and short-term hedges are being tested while the broader macro backdrop still leans heavy.
Dow Jones Analysis Today: 51,500 Liquidity Under Pressure
Dow Jones trades at 51,462, down 1.2% intraday, making it the strongest allowed mover outside commodities.
The Dow Jones Industrial Average is the weak link among the major US indices right now. At 51,462, the index is down 1.2% on the session, while the S&P 500 is only down 0.4% at 7,552 and the Nasdaq Composite is basically flat at 25,978. That relative weakness matters because the Dow is not being dragged lower by a full-market liquidation. It is leading the downside on its own profile.
Outside commodities, this is the largest move on the board. WTI Crude Oil is down 2.5% to $99.85, but crude is still sitting near a psychologically important $100 area. Gold is firmer at $4,408.90, up 0.5%, while Bitcoin and Ethereum are green. The message is mixed, not panicked.
For traders who use SMC trading strategies, this is exactly the kind of session where context matters more than candle color. The Dow is not just red. It is red into a visible liquidity pool while macro pressure remains unresolved.
Price is pressing the 51,400-51,500 liquidity pocket, where a clean sweep could expose weak hands before any relief bounce.
The 51,400 to 51,500 band is close enough to spot that traders should stop treating it as a future level and start treating it as live order flow. At 51,462, price is already inside the pocket. A clean raid through 51,400 would likely trigger stops from late buyers and force short-term longs to make a decision under pressure.
That kind of stop-run can produce two very different reactions. One is acceptance below the pocket, with sellers holding control and price expanding lower. The other is a sharp rejection, where the flush clears weak hands and buyers step in with enough force to reclaim the level. The first reaction is continuation. The second is a relief attempt.
The mistake I see retail traders make here is assuming the first touch of a liquidity zone must be a buy. It doesn’t work that way. Liquidity attracts price. It does not automatically reverse price.
Frame the zone as active liquidity under pressure, not confirmed support, because price is already trading inside the area.
My view is blunt: 51,400 to 51,500 is not confirmed support unless buyers defend after the sweep or quickly recapture the zone with conviction. Until that happens, the Dow is trading inside a vulnerable pocket where failed longs can become fuel for the next leg lower.
That distinction is critical for indices trading. A support trader wants to be early. A liquidity trader wants proof. I prefer proof, especially when treasury yields are still near 5% and crude oil is near $100. Those are not soft conditions for cyclical equity exposure.
Why Is The Dow Leading The Weakness Today?
The S&P 500 is down 0.4% at 7,552 while the Nasdaq is roughly flat at 25,978, showing Dow-led weakness rather than broad panic.
The Dow’s 1.2% intraday drop looks worse when compared with the rest of the index complex. The S&P 500 at 7,552 is down 0.4%, which is soft but manageable. The Nasdaq at 25,978 is roughly flat, showing that growth and mega-cap tech are not under the same pressure as the Dow’s value-heavy components.
That divergence tells me this is more selective than systemic. The market is selling certain exposures harder: industrials, financials, transports, and dividend-sensitive names. Those areas sit closer to the Dow’s DNA than the Nasdaq’s.
Broader market updates have also flagged pressure across US equities alongside oil strength near major psychological levels, including reports such as Bitget’s daily market note on oil topping $100 as US stocks fell. I don’t treat that as a trading signal by itself, but it fits the cross-asset picture.
Cyclical and value-heavy Dow exposure is more vulnerable when yields stay elevated and energy costs remain near stress levels.
High yields punish long-duration growth assets on valuation math, but they also weigh on old-economy businesses through financing costs, demand sensitivity, and margin pressure. Add near-$100 WTI, and the Dow starts to carry a different kind of burden. Transport names face fuel pressure. Industrials face input-cost pressure. Financials deal with curve and credit concerns.
That is why the Dow can underperform even while the Nasdaq refuses to break. Traders sometimes assume tech must lead every risk-off move. That isn’t always true. In a high-yield, high-energy-cost environment, cyclicals can bleed first.
For a deeper oil-specific read, the current crude backdrop pairs well with this WTI Crude Oil analysis around the $100 liquidity test. Crude is not a side note here. It is part of the pressure system around the Dow.
The divergence suggests rotation and controlled distribution, not a full-market volatility liquidation.
VIX is down 12.8% to 15.44. That does not mean the Dow’s weakness is harmless, but it does argue against a disorderly volatility shock. When volatility is falling while one index underperforms, I read that as controlled distribution or rotation rather than broad forced selling.
After years trading index futures, I’ve learned to respect these quiet distribution sessions. They don’t feel dramatic. They don’t always produce screaming headlines. But they can still damage market structure one level at a time while traders keep waiting for panic that never arrives.
Market Structure: Supply At 51,900-52,100
Market structure remains heavy while the Dow trades below the 51,900-52,100 reclaim zone.
The Dow needs to do more than bounce to repair the tape. The 51,900 to 52,100 area is the near-term reclaim zone I’m watching. While price trades below that band, the structure remains heavy because every rally risks running into trapped longs and fresh short interest.
From a Smart Money order block perspective, that area may behave like supply if prior buying failed there and left positions underwater. The market often revisits those zones to test whether sellers still care. Right now, sellers have no reason to panic unless price recaptures that band and holds above it.
That zone now acts as near-term supply, where trapped longs and short-term sellers may respond to any bounce.
When price breaks away from a prior balance area and then trades underneath it, the old support zone often flips into supply. The 51,900 to 52,100 pocket now carries that risk. A bounce into it can look bullish on a five-minute chart while still being nothing more than a retest of supply on the broader intraday structure.
I care less about the first touch and more about the reaction after it. A fast rejection from 51,900 to 52,100 would confirm that sellers are defending the prior breakdown. A grind into the zone with weak volume and no breadth improvement would also be suspect. Strong acceptance above it would be different.
A sustained reclaim would be the first sign that downside pressure is easing, but failure below it keeps sellers in control.
The Dow does not need to recover the entire session in one move. It does need to reclaim the correct area. A sustained move back above 51,900 to 52,100 would show that sellers are losing control of the immediate structure and that the 51,400 to 51,500 raid may have done its job.
Failure below that zone keeps the burden of proof on buyers. That’s where disciplined traders should avoid confusing a bounce with a shift in control. For more index and cross-market setups, I’d keep an eye on more market analysis rather than staring at the Dow in isolation.
Are Treasury Yields Still The Main Equity Headwind?
The US 10-year yield is still elevated at 4.953% despite being down 1.0% on the session.
The 10-year Treasury yield is at 4.953%, down 1.0% on the day, but still close enough to 5% to keep equity valuations under pressure. Traders should not overread the one-session dip. The level matters more than the daily change when yields are this high.
Near-5% yields compete directly with equities. Investors can demand more compensation for risk, and that makes weaker earnings quality, high debt loads, and dividend sensitivity more exposed. The Dow has plenty of components that react to that kind of pressure.
Near-5% Treasury yields keep pressure on rate-sensitive equity valuations, especially industrials, financials, transports, and dividend-sensitive Dow components.
Industrials and transports care about financing costs and demand. Financials care about curve dynamics, credit risk, and loan growth. Dividend-sensitive names compete with bonds for income flows. That is why treasury yields remain central to this Dow Jones analysis even when the yield is slightly lower intraday.
The equity market can tolerate high yields when earnings momentum is strong and breadth is broad. Today’s tape does not show that across the Dow. The Nasdaq holding flat helps sentiment, but it does not remove pressure from value-heavy and cyclical exposures.
Yields, not dollar strength, remain the cleaner macro explanation for valuation pressure in today’s Dow Jones analysis.
DXY is at 100.08, down 0.2%. That is not a strong-dollar squeeze on equities. The dollar remains around a major handle, and recent commentary has noted the dollar index trading back above 100, including Mitrade’s coverage of the dollar index moving above 100. Still, the intraday drag on the Dow is cleaner through yields and oil than through dollar strength.
My opinion: traders are overcomplicating this session if they make the dollar the main story. Elevated yields, expensive energy, and weak Dow relative strength explain the move better.
Macro Crosscurrents: Oil, Dollar, And VIX
DXY sits at 100.08 and is slightly lower on the day, so dollar strength is not the main drag on equities.
The dollar is not giving equities a relief rally, but it also isn’t delivering the main hit today. DXY at 100.08, lower by 0.2%, is stable rather than explosive. EUR/USD is at 1.1491, up 0.2%. GBP/USD is flat near 1.3384. USD/JPY is lower by 0.4% at 155.58.
That forex board does not scream dollar stress. It points to a mixed macro regime, which matches the broader snapshot. Crypto is firmer. Gold is higher. Oil is lower on the day but still expensive. Equities are split by index exposure.
WTI remains near $99.85 even after a 2.5% drop, keeping margin pressure on transport and energy-cost-sensitive Dow names.
WTI at $99.85 is the number Dow traders should respect. A 2.5% daily drop sounds like relief, but the absolute level remains near $100. That keeps input costs and fuel sensitivity on the radar for companies tied to transportation, manufacturing, and logistics.
Recent global market coverage, including The Economic Times markets page, has kept oil, equities, and rates in the same conversation for good reason. These assets are connected through inflation expectations, margins, and central-bank pricing.
VIX is down 12.8% to 15.44, supporting the view that this is controlled distribution rather than a volatility shock.
VIX at 15.44 is low relative to the kind of fear traders usually associate with aggressive equity selloffs. That does not give bulls a free pass. It tells me the weakness is being expressed through rotation, index divergence, and supply defense rather than a volatility explosion.
Key read: the Dow can remain under pressure even with VIX falling, especially when sellers control structure and buyers have not reclaimed 51,900 to 52,100.
That is the part many traders miss. Low VIX can coexist with steady downside in a specific index. The absence of panic does not equal the presence of demand.
What Should Indices Traders Watch Next?
Watch for a liquidity sweep through 51,400-51,500 and whether sellers accept lower prices or buyers defend after the sweep.
The first decision point is already active. Price is sitting in the 51,400 to 51,500 pocket, so traders should watch the reaction rather than predict it. A clean move below 51,400 followed by immediate recovery would suggest a stop-run and potential relief. Acceptance below 51,400 would keep downside risk alive.
I want to see how fast price moves, whether candles expand with follow-through, and whether the S&P 500 and Nasdaq start confirming the Dow’s weakness. One index breaking alone is useful information. Three indices pressing lower together is a different tape.
Track the 51,900-52,100 supply zone as the key upside reclaim area for any bullish shift in market structure.
The upside map is equally clear. The 51,900 to 52,100 band is the area buyers need to recover. Below it, rallies are vulnerable. Above it, sellers start losing the clean structure they currently hold.
For traders studying market structure and institutional price behavior, this is a good example of why levels must be treated dynamically. A zone that mattered as support can become supply after price loses it. That idea sits at the core of practical SMC trading strategies, not the cartoon version people post on social media.
For indices trading, align entries with liquidity reactions, Treasury yield direction, WTI pressure, and relative strength versus the S&P 500 and Nasdaq.
This is a level-to-level indices trading environment. I would not chase red candles into 51,400, and I would not buy the first green candle without evidence that buyers are absorbing supply. The better approach is to map the liquidity pocket, wait for the reaction, then judge whether macro conditions confirm or reject the move.
- Bearish continuation signal: price accepts below 51,400 while yields stay near 5% and Dow weakness spreads into the S&P 500.
- Relief signal: price sweeps below the pocket, reclaims 51,500, and starts building higher lows toward 51,900.
- Structure improvement: the Dow recaptures 51,900 to 52,100 and holds above it while oil and yields stop pressing risk assets.
That’s the working map. Clean levels. Clear invalidation. No hero trades.
FAQ
What is the key level in this Dow Jones analysis today?
The key area is the 51,400 to 51,500 liquidity pocket. With the Dow trading near 51,462 and down 1.2% intraday, price is already pressuring that zone. A clean sweep could flush weak longs before any relief attempt, but confirmation matters afterward on lower timeframes.
Why are Treasury yields pressuring the Dow Jones today?
The 10-year Treasury yield is still elevated at 4.953%, even after slipping 1.0% on the day. Near-5% yields raise discount-rate pressure on equity valuations and can hit cyclical, industrial, financial, transport, and dividend-sensitive Dow components harder during weak sessions.
Does a lower VIX mean the Dow selloff is not serious?
No. VIX at 15.44, down 12.8%, suggests the move is controlled distribution rather than broad volatility liquidation. That can still damage market structure if price holds below supply and liquidity raids attract only weak, short-lived bounces from buyers.
What would improve the Dow’s market structure?
A sustained reclaim of 51,900 to 52,100 would improve near-term market structure because that zone now acts as supply. Bulls also need stabilization in treasury yields and oil, plus better follow-through against the S&P 500 and Nasdaq. Without those signals, rallies into supply remain vulnerable.
How should traders approach indices trading in this setup?
Traders should treat this as a level-to-level indices trading environment, not a panic tape. Watch reactions at 51,400 to 51,500 and 51,900 to 52,100, manage risk tightly, and avoid chasing candles while yields and energy costs keep Dow cyclicals under pressure.
The next meaningful answer should come from the 51,400 to 51,500 reaction first, then the 51,900 to 52,100 reclaim test. Do buyers defend the raid, or does the Dow start accepting lower prices into the next session?
Disclaimer: This analysis is for educational purposes only and is not financial advice. Trading indices involves risk, and you should make decisions based on your own plan, risk tolerance, and research.