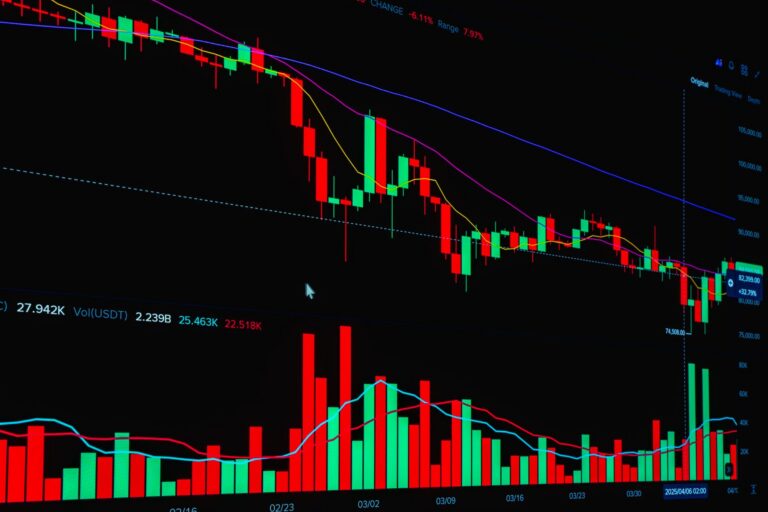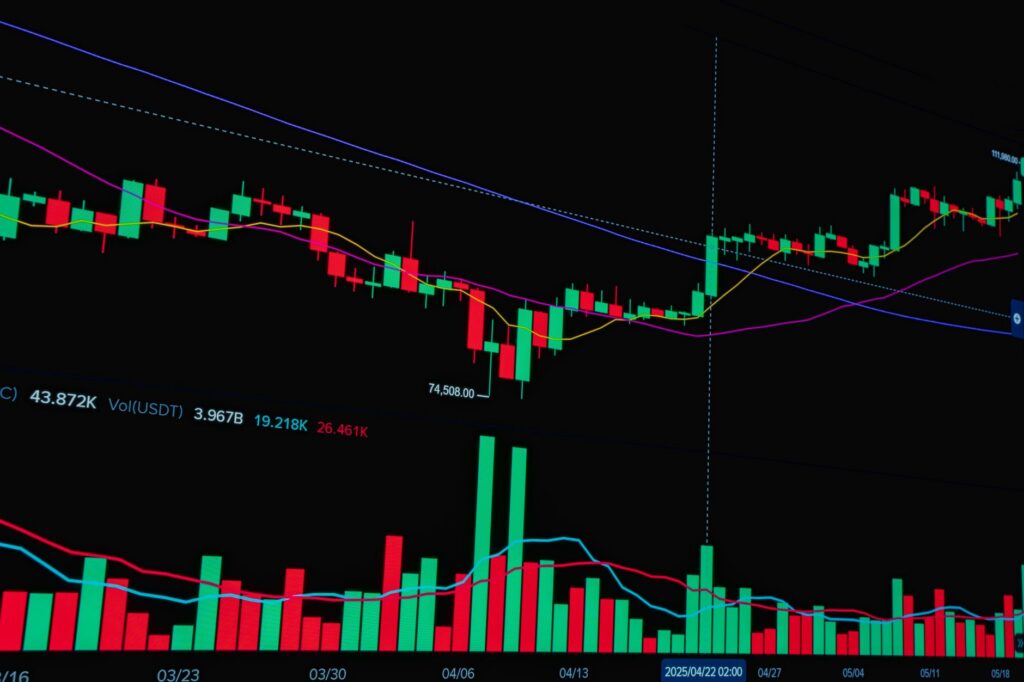
Bitcoin is trading at $79,956, down 0.9% over 24 hours, and that small slip matters because it leaves price parked just under the $80,000 handle. My bitcoin price analysis is simple here: sellers still have the immediate advantage while BTC remains below $80K, but the tape is not showing panic. It is showing controlled pressure, liquidity hunting, and a market waiting for the next macro excuse.
That distinction matters. A clean liquidation cascade looks different from this. VIX is only 16.95, up 0.2%, while the S&P 500 and Nasdaq are both slightly green. Bitcoin is weaker, but broad markets are not falling apart. To me, that usually means traders should focus less on dramatic narratives and more on where the next stop-run is likely to occur.
Bitcoin Price Analysis Snapshot: BTC Slips Below $80K
BTC trades at $79,956, down 0.9% over 24 hours, making it the strongest allowed mover outside today’s excluded commodities group.
Bitcoin is the main liquid risk asset showing notable weakness in this snapshot, with ETH also down 0.8% at $2,320. That puts BTC in a vulnerable but still orderly position. The move is large enough to matter for intraday structure, but not large enough to call it capitulation.
I’m treating this as a liquidity-driven market rather than a trend-confirmed breakdown. The current price is only a few dollars below the psychological $80,000 zone, so a lot of traders are likely anchored to that level. That creates poor conditions for emotional market orders and better conditions for waiting on confirmation.
For broader crypto context, I’d pair this read with more crypto analysis, especially when BTC and ETH start moving together around macro catalysts.
Price is sitting just below the $80,000 psychological handle, keeping liquidity sellers in control until buyers prove a reclaim.
Round numbers are rarely magical, but they are useful because traders make decisions around them. Stops cluster there. Breakout orders sit there. Late shorts defend there. Late longs panic there. That’s why $80,000 matters more than a random $79,873 print on the chart.
While BTC remains below $80,000, sellers can argue that the market has failed to hold the obvious level. Buyers need more than a wick. They need a fast recapture, expansion away from the level, and acceptance above it. Without that, every bounce below $80K risks becoming another lower-timeframe short entry.
VIX at 16.95 signals the tape is mixed rather than panicking, so the move is more controlled risk-off trading than capitulation.
The volatility backdrop does not support a full-blown fear event. VIX at 16.95 is elevated enough to show caution, but it is nowhere near the kind of level that screams forced liquidation across every risk asset. The Dow is up 0.2%, the S&P 500 is up 0.3%, and the Nasdaq is up 0.3%.
That mixed regime changes how I read BTC. Bitcoin can still sell off in this environment, but the better trade location usually comes after a raid into liquidity, not from chasing the first red candle under a round number. Controlled risk-off trading tends to punish impatience.
Why Is $80,000 The Immediate Bitcoin SMC Battleground?
The $80,000 handle is the key bitcoin SMC decision point because stops, breakout orders, and late-position liquidity often cluster around round numbers.
From a Smart Money Concepts trading perspective, the $80,000 level is the obvious battlefield. Obvious levels attract liquidity. That does not mean price must reverse there, and it does not mean every sweep is a buy. It means the level is useful because other traders are likely reacting to it.
This is where my opinion is firm: traders overcomplicate SMC when they ignore the obvious price magnet in front of them. A round-number handle near spot, combined with macro pressure, usually carries more practical value than a tiny lower-timeframe imbalance buried in the noise.
The term bitcoin smc gets thrown around too loosely, but the core idea is practical. Find where orders are likely resting. Wait for the market to reveal whether that liquidity is being used for continuation or reversal. Then manage risk around the invalidation point, not around hope.
With spot price just below $80,000, the market is inviting stop-hunts on both sides rather than offering a clean directional signal.
Price sitting just under $80K creates a trap-heavy environment. Shorts who entered late may have stops above the handle. Longs who bought the prior support area may have stops below the nearby intraday lows. Both pools are close enough to be raided.
That is why I do not like treating the first move away from $80,000 as the whole story. A push under nearby lows can look bearish, then snap back. A bounce above the handle can look bullish, then fail. The better signal is the reaction after the grab.
Acceptance below $80,000 favors sellers, while a sharp displacement back above it would challenge the bearish intraday narrative.
Acceptance is the key word. A wick below $80,000 is information, but it is not enough. Several closes below the handle, weak bounces, and selling pressure returning near $80K would keep bears in control. A fast expansion back above the level would tell a different story.
The strongest bullish response would be a failed breakdown. Price trades below the obvious liquidity, draws in sellers, then recaptures $80,000 with momentum. That type of move can force late shorts to cover and attract sidelined buyers looking for confirmation.
Where Is BTC Liquidity Sitting Now?
Downside btc liquidity is likely concentrated around the $79,500-$79,200 intraday pocket, where a clean sweep could flush weak longs.
The nearest downside btc liquidity pocket I’m watching sits around $79,500 to $79,200. That zone is close enough to current price to matter intraday, and far enough below the round number to catch weak longs who are using tight stops beneath the local structure.
A move into that pocket would not surprise me. Bitcoin often trades through obvious lows before showing its real intention. The important part is what happens after the raid. Thin rebounds tell me sellers are still comfortable. Aggressive buy-side response tells me the market may have used the downside liquidity to reload.
- Immediate decision level: $80,000
- Downside liquidity pocket: $79,500 to $79,200
- Upside liquidity zone: $80,600 to $81,200
- Macro pressure point: 10-year yield at 5.003% and DXY at 102.29
A sweep below $79,500-$79,200 is only bullish if price rapidly reclaims $80,000 with displacement and follow-through.
A downside sweep by itself is not bullish. Plenty of traders get trapped by assuming every stop-run must reverse. In a weak tape, the market can take the lows, pause briefly, and continue lower as buyers discover there is no real demand behind the move.
The bullish version has a different feel. BTC dips through $79,500 to $79,200, fails to continue lower, then drives back above $80,000 with range expansion. Follow-through above the handle would matter because it would show that sellers below the level are not getting paid.
Upside liquidity likely rests above $80,600-$81,200, where late shorts may be forced to cover if risk appetite improves.
The upside target zone is $80,600 to $81,200. That is where short-term bearish positioning can start to feel pressure. A move there would not automatically mean a full trend reversal, but it would challenge the intraday bearish thesis.
That zone also matters because it sits close to the failed support area traders will be watching. Once a market loses a major round number, the first recapture attempt often becomes crowded. Bears defend it. Bulls chase it. Liquidity builds fast.
For traders comparing BTC structure with broader market behavior, more market analysis can help keep the crypto read aligned with indexes, forex, yields, and volatility.
DXY Bitcoin Headwind: 5% Yields And Risk-Off Pressure
The US 10-year Treasury yield remains elevated at 5.003%, keeping pressure on duration-style risk assets, including Bitcoin.
The 10-year Treasury yield at 5.003% is a real headwind. Bitcoin is not a bond, but it trades like a liquidity-sensitive asset when macro pressure rises. Higher real-yield expectations can reduce the appetite for speculative exposure because cash and short-duration instruments become harder competition.
That does not mean Bitcoin must fall every time yields are high. Markets are never that clean. But elevated yields raise the bar for upside continuation, especially when BTC is already struggling to reclaim a major round number.
DXY is firm at 102.29, up 0.1%, while EUR/USD trades lower at 1.1128, reinforcing a dollar-liquidity headwind.
The dollar is not exploding higher, but it is firm. DXY at 102.29, up 0.1%, combined with EUR/USD lower at 1.1128, creates a mild but relevant dollar-liquidity drag. That matters for BTC because crypto often performs better when dollar conditions loosen and traders increase risk exposure.
The dxy bitcoin relationship is never one-to-one, but I respect it when price is sitting at a decision level. A strong dollar can delay upside even when crypto-native narratives look supportive. A softening dollar can help BTC squeeze through nearby short liquidity faster than chart-only traders expect.
The dxy bitcoin relationship matters this week because a stronger dollar can drain speculative flow and delay crypto upside continuation.
Macro positioning is central-bank-heavy, and that makes the dollar more important than usual. External market commentary has also framed the week around central bank decisions for the dollar, gold, euro, and yen, which reinforces why FX pressure belongs in the BTC conversation as noted in this central bank market post.
When I’ve traded crypto through macro-heavy weeks, the worst entries usually come from ignoring the dollar because the BTC chart looks “clean.” The chart can be clean and still fail if the liquidity backdrop is leaning the other way.
Can The Fed Rate Decision Shift The Next BTC Move?
The macro catalyst is central-bank-heavy positioning, with traders watching Fed expectations for the next liquidity impulse.
The upcoming fed rate decision is less about the headline alone and more about how markets reprice the path after it. Traders care about rate-cut timing, inflation language, labor-market sensitivity, and the tone around financial conditions.
Several market calendars have flagged a heavy central bank week alongside US Q3 GDP and September PCE in this macro calendar note. That matters because BTC is sitting near a trigger level while liquidity expectations are still movable.
US GDP and PCE data can reshape rate-cut timing, real-yield expectations, and short-term crypto risk appetite.
GDP and PCE are not crypto events on paper, but they can become crypto events through yields and the dollar. Hot inflation pressure can keep yields elevated. Softer data can revive rate-cut expectations. Either path can shift risk appetite quickly.
For BTC, the practical question is whether macro data gives buyers enough confidence to reclaim $80,000 or gives sellers more ammunition to defend it. I don’t need to predict the data print. I need to see how Bitcoin behaves after the market digests it.
A dovish repricing could fuel a move into $80,600-$81,200 liquidity, while hawkish yields may keep sellers active below $80,000.
A dovish shift would likely pressure yields and the dollar, which could help BTC squeeze toward $80,600 to $81,200. That is the zone where late shorts become exposed. The move would be stronger if it starts from a downside liquidity grab rather than from a slow grind directly under resistance.
A hawkish repricing keeps the setup heavier. Under that version, $80,000 remains resistance, bounces become suspect, and the market can continue searching for lower liquidity. For a broader view on how finance cycles and policy narratives can shape market behavior over time, the Econlife finance archive is useful background reading.
Bitcoin SMC Trading Plan: Confirmation Before Bias
Bullish scenario: sweep $79,500-$79,200, reclaim $80,000 quickly, then target upside liquidity above $80,600-$81,200.
The bullish path is specific. BTC raids the $79,500 to $79,200 pocket, rejects lower pricing, then recaptures $80,000 with strong candles and follow-through. That would suggest the market used the lower pocket to clear weak longs before moving back through the obvious handle.
After that, $80,600 to $81,200 becomes the logical magnet. I would still want to see acceptance above $80,000 before trusting the move. A single wick through the handle is not enough, especially with DXY firm and yields still near 5%.
Bearish scenario: fail to reclaim $80,000, accept below the handle, and extend toward deeper intraday liquidity.
The bearish case is also clean. Price keeps rejecting below $80,000, buyers fail to generate momentum, and lower-timeframe structure starts building beneath the handle. That would support continued selling into deeper intraday liquidity.
Under that path, the $79,500 to $79,200 zone may not hold. It may only pause the move. That is why traders need to separate a liquidity touch from a confirmed reversal. They are not the same thing.
For related crypto risk reads, ETH is worth monitoring because it often confirms or contradicts the tone in BTC. The recent Ethereum risk-off flush analysis gives a useful comparison point, and broader Ethereum price analysis during yield pressure helps frame whether weakness is isolated or market-wide.
Risk rule: avoid predicting the sweep direction; wait for displacement, acceptance, and macro confirmation before committing size.
My rule here is boring, but it keeps traders alive. Do not predict the sweep direction. Wait for the market to show the raid, the reaction, and the acceptance. Then decide whether the trade location is worth the risk.
That is especially true during risk off trading conditions. The regime is mixed, not panicked, but BTC is weaker than the major US indexes right now. That relative weakness deserves respect until buyers prove they can reclaim the $80,000 level and defend it.
My read: Below $80,000, sellers control the immediate tape. Above $80,000 with expansion, the bearish intraday story starts to crack. The $79,500 to $79,200 pocket is the near-term trap zone.
FAQ
What is the current Bitcoin price analysis thesis?
Bitcoin is trading at $79,956, down 0.9% in 24 hours, with sellers holding price just below the $80,000 handle. The thesis is controlled pressure rather than panic. High yields, firm DXY, and Fed-heavy positioning are limiting upside follow-through while buyers still need a confirmed reclaim of $80,000.
Why is $80,000 important for BTC liquidity?
The $80,000 level is a psychological magnet where stops, breakout orders, and late shorts can cluster. Because BTC trades just below it, both sides are vulnerable. Sellers want acceptance under the handle, while buyers need a fast reclaim with clear expansion and follow-through.
What would make a liquidity sweep bullish?
A move below the $79,500 to $79,200 intraday liquidity pocket becomes constructive only when Bitcoin quickly reclaims $80,000 with strong displacement. Without that reclaim, the stop-run can turn into continuation, leaving trapped buyers exposed to another downside leg during risk-off conditions.
How do DXY and yields affect Bitcoin?
A 5.003% US 10-year yield raises the hurdle for duration-style risk assets, including Bitcoin. A firm DXY at 102.29 tightens dollar liquidity and can pressure crypto flows, especially when EUR/USD is lower and macro traders reduce leverage before central bank events.
What should traders watch into the Fed rate decision?
Watch whether price accepts below $80,000 or reclaims it after any liquidity sweep. The Fed rate decision, US GDP, and PCE can reset dollar-liquidity expectations, so confirmation matters more than prediction while VIX shows mixed risk appetite rather than outright panic.
Bitcoin’s next clean signal should come from the reaction around $80,000, not from guessing the first wick. Are buyers strong enough to reclaim the handle, or will sellers keep using it as resistance?
Disclaimer: This analysis is for educational purposes only and is not financial advice. Trading crypto involves risk, and you should make decisions based on your own plan, risk tolerance, and independent research.